1 Data preparation
This week we will be mapping crime hotspots in the London boroughs of Camden and Islington. The data we will be working with for this week’s task are downloaded from the data.police.uk website.
You are expected to work through the computer tutorial individually and at your own pace, but you will submit this week’s worksheet as a group.
1.1 Getting started
Some of you may already have played around with some GIS software such as ArcGIS or at very least have been introduced to ArcGIS Online in Geography in the Field I, but today we will be using the open-source GIS software suite QGIS.
QGIS is an open-source graphic user interface GIS with many community developed add-on packages that provide additional functionality to the software. A copy of QGIS can be accessed through the UCL Application Store on all cluster room computers as well as on Desktop@UCL Anywhere.
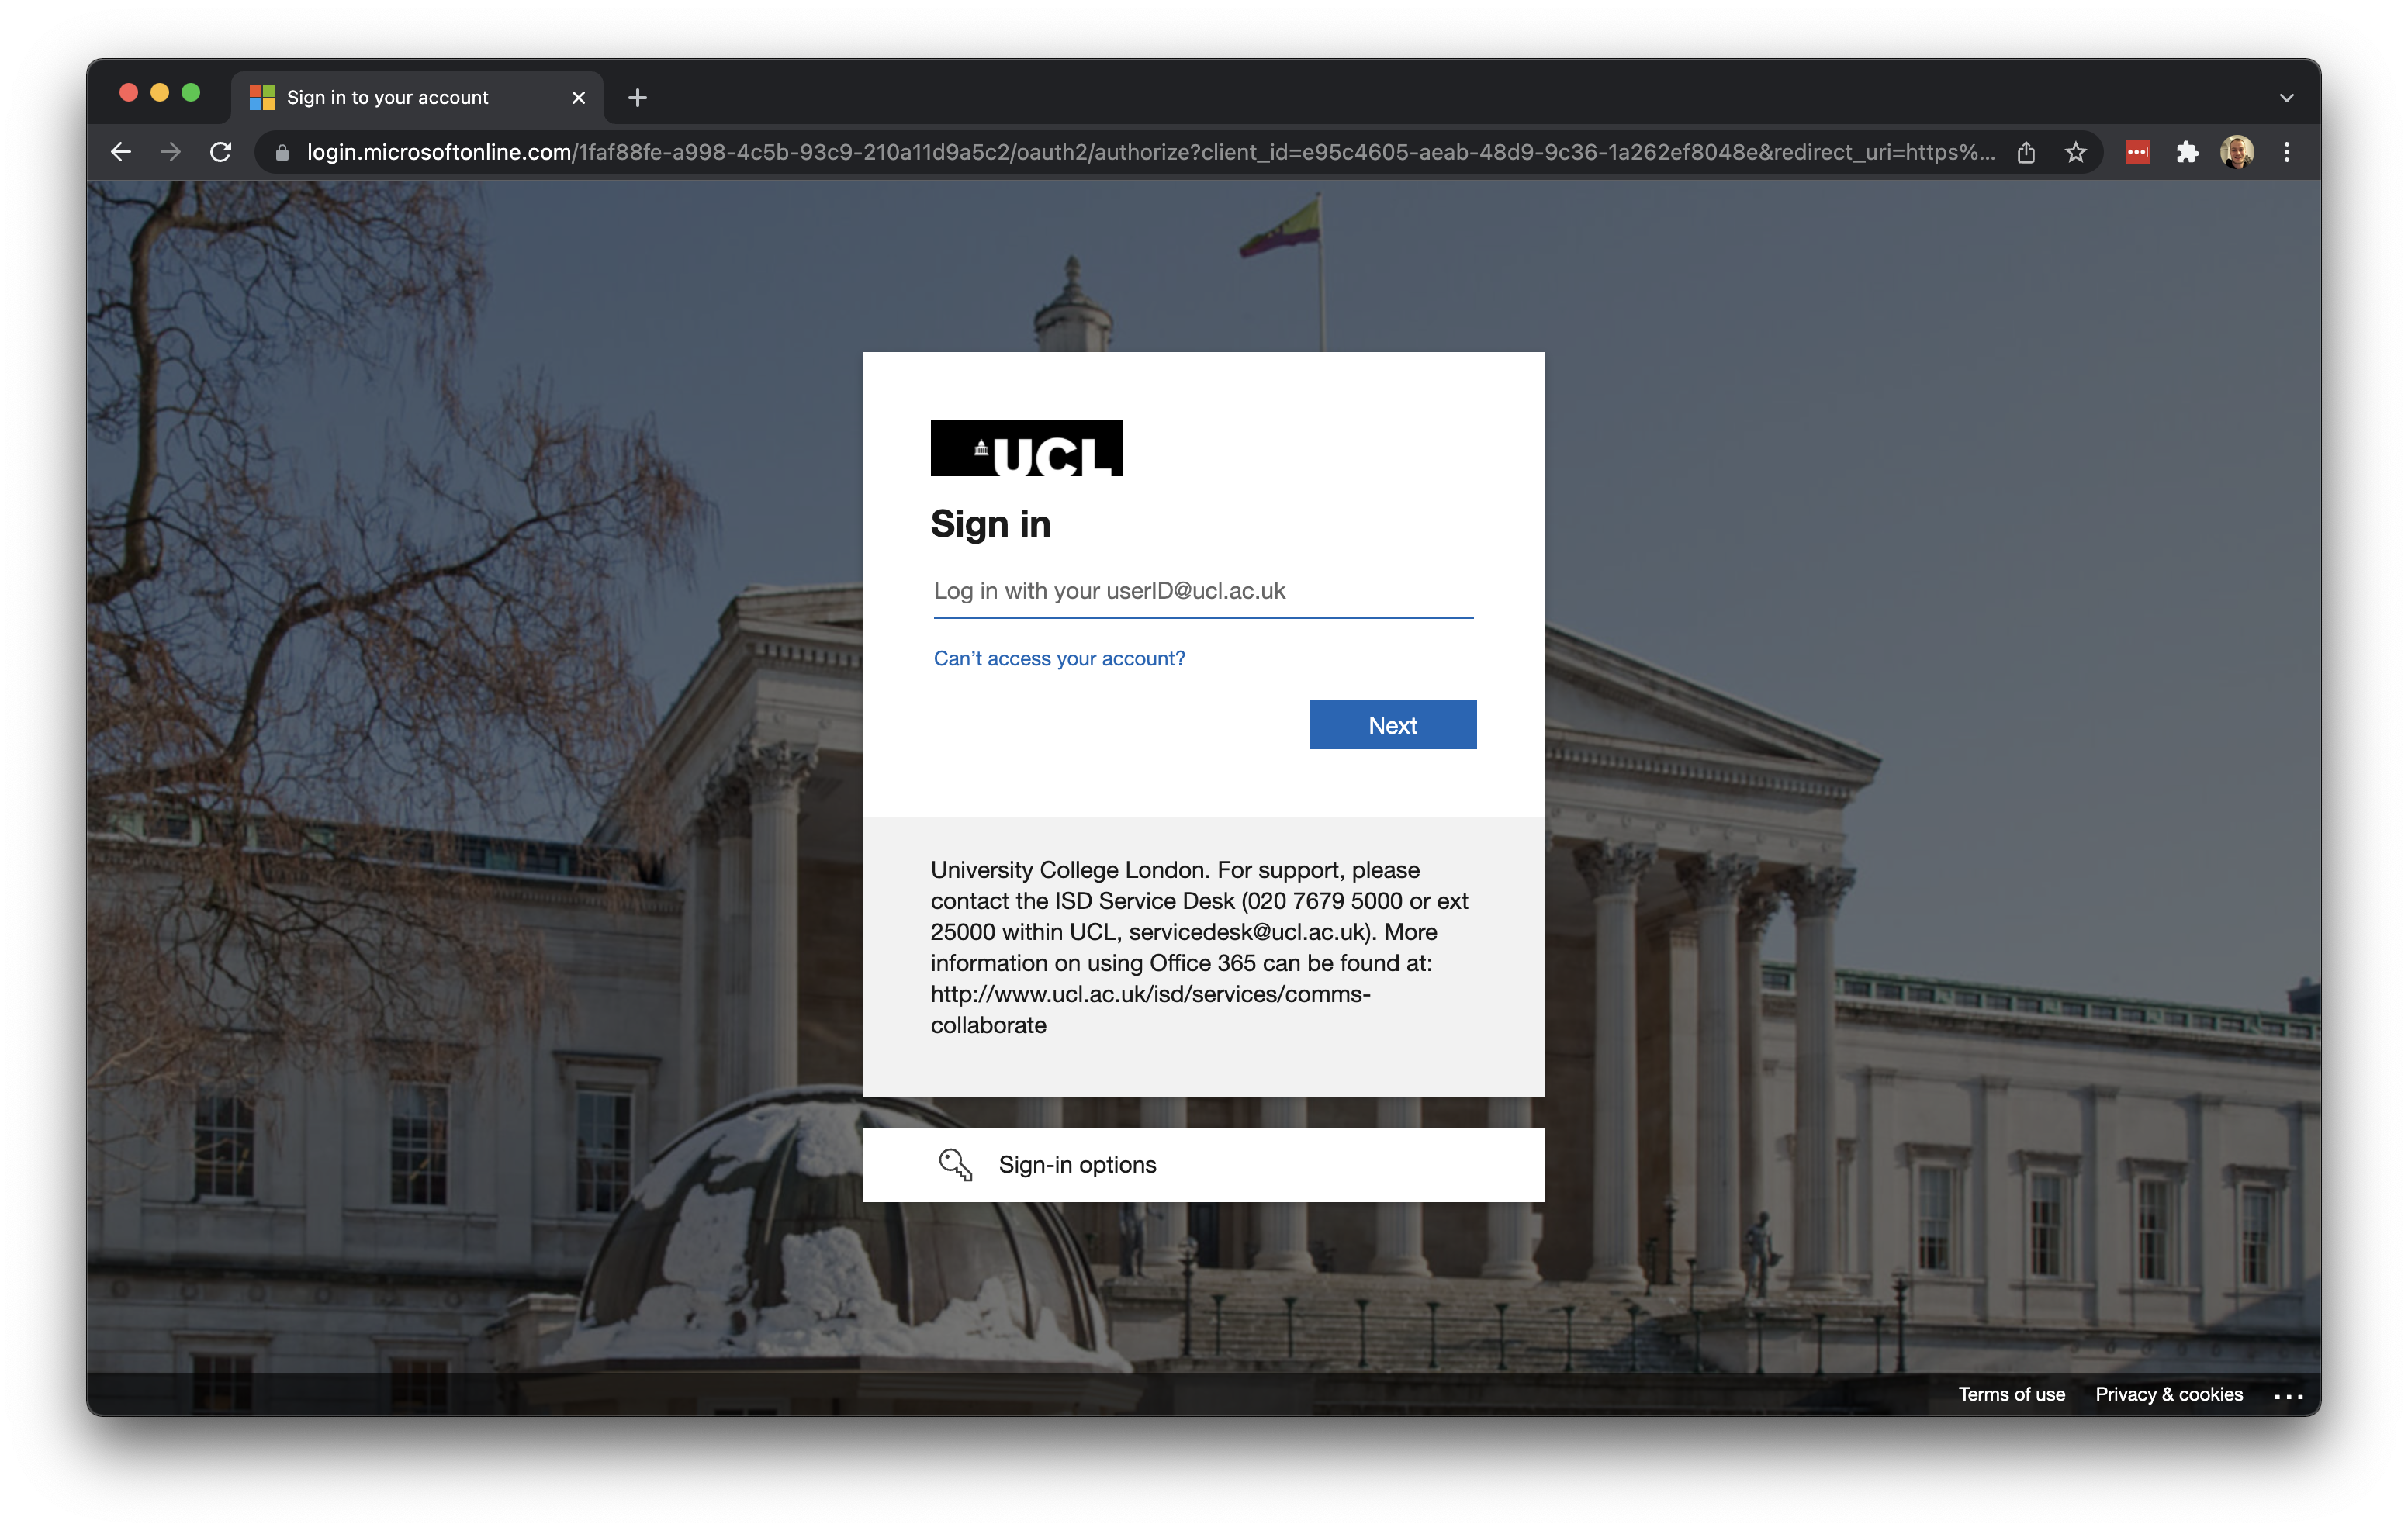
Let us get started by opening an internet browser such as Google Chrome or Microsoft Edge. Navigate to: https://ucldesktop.cloud.com.
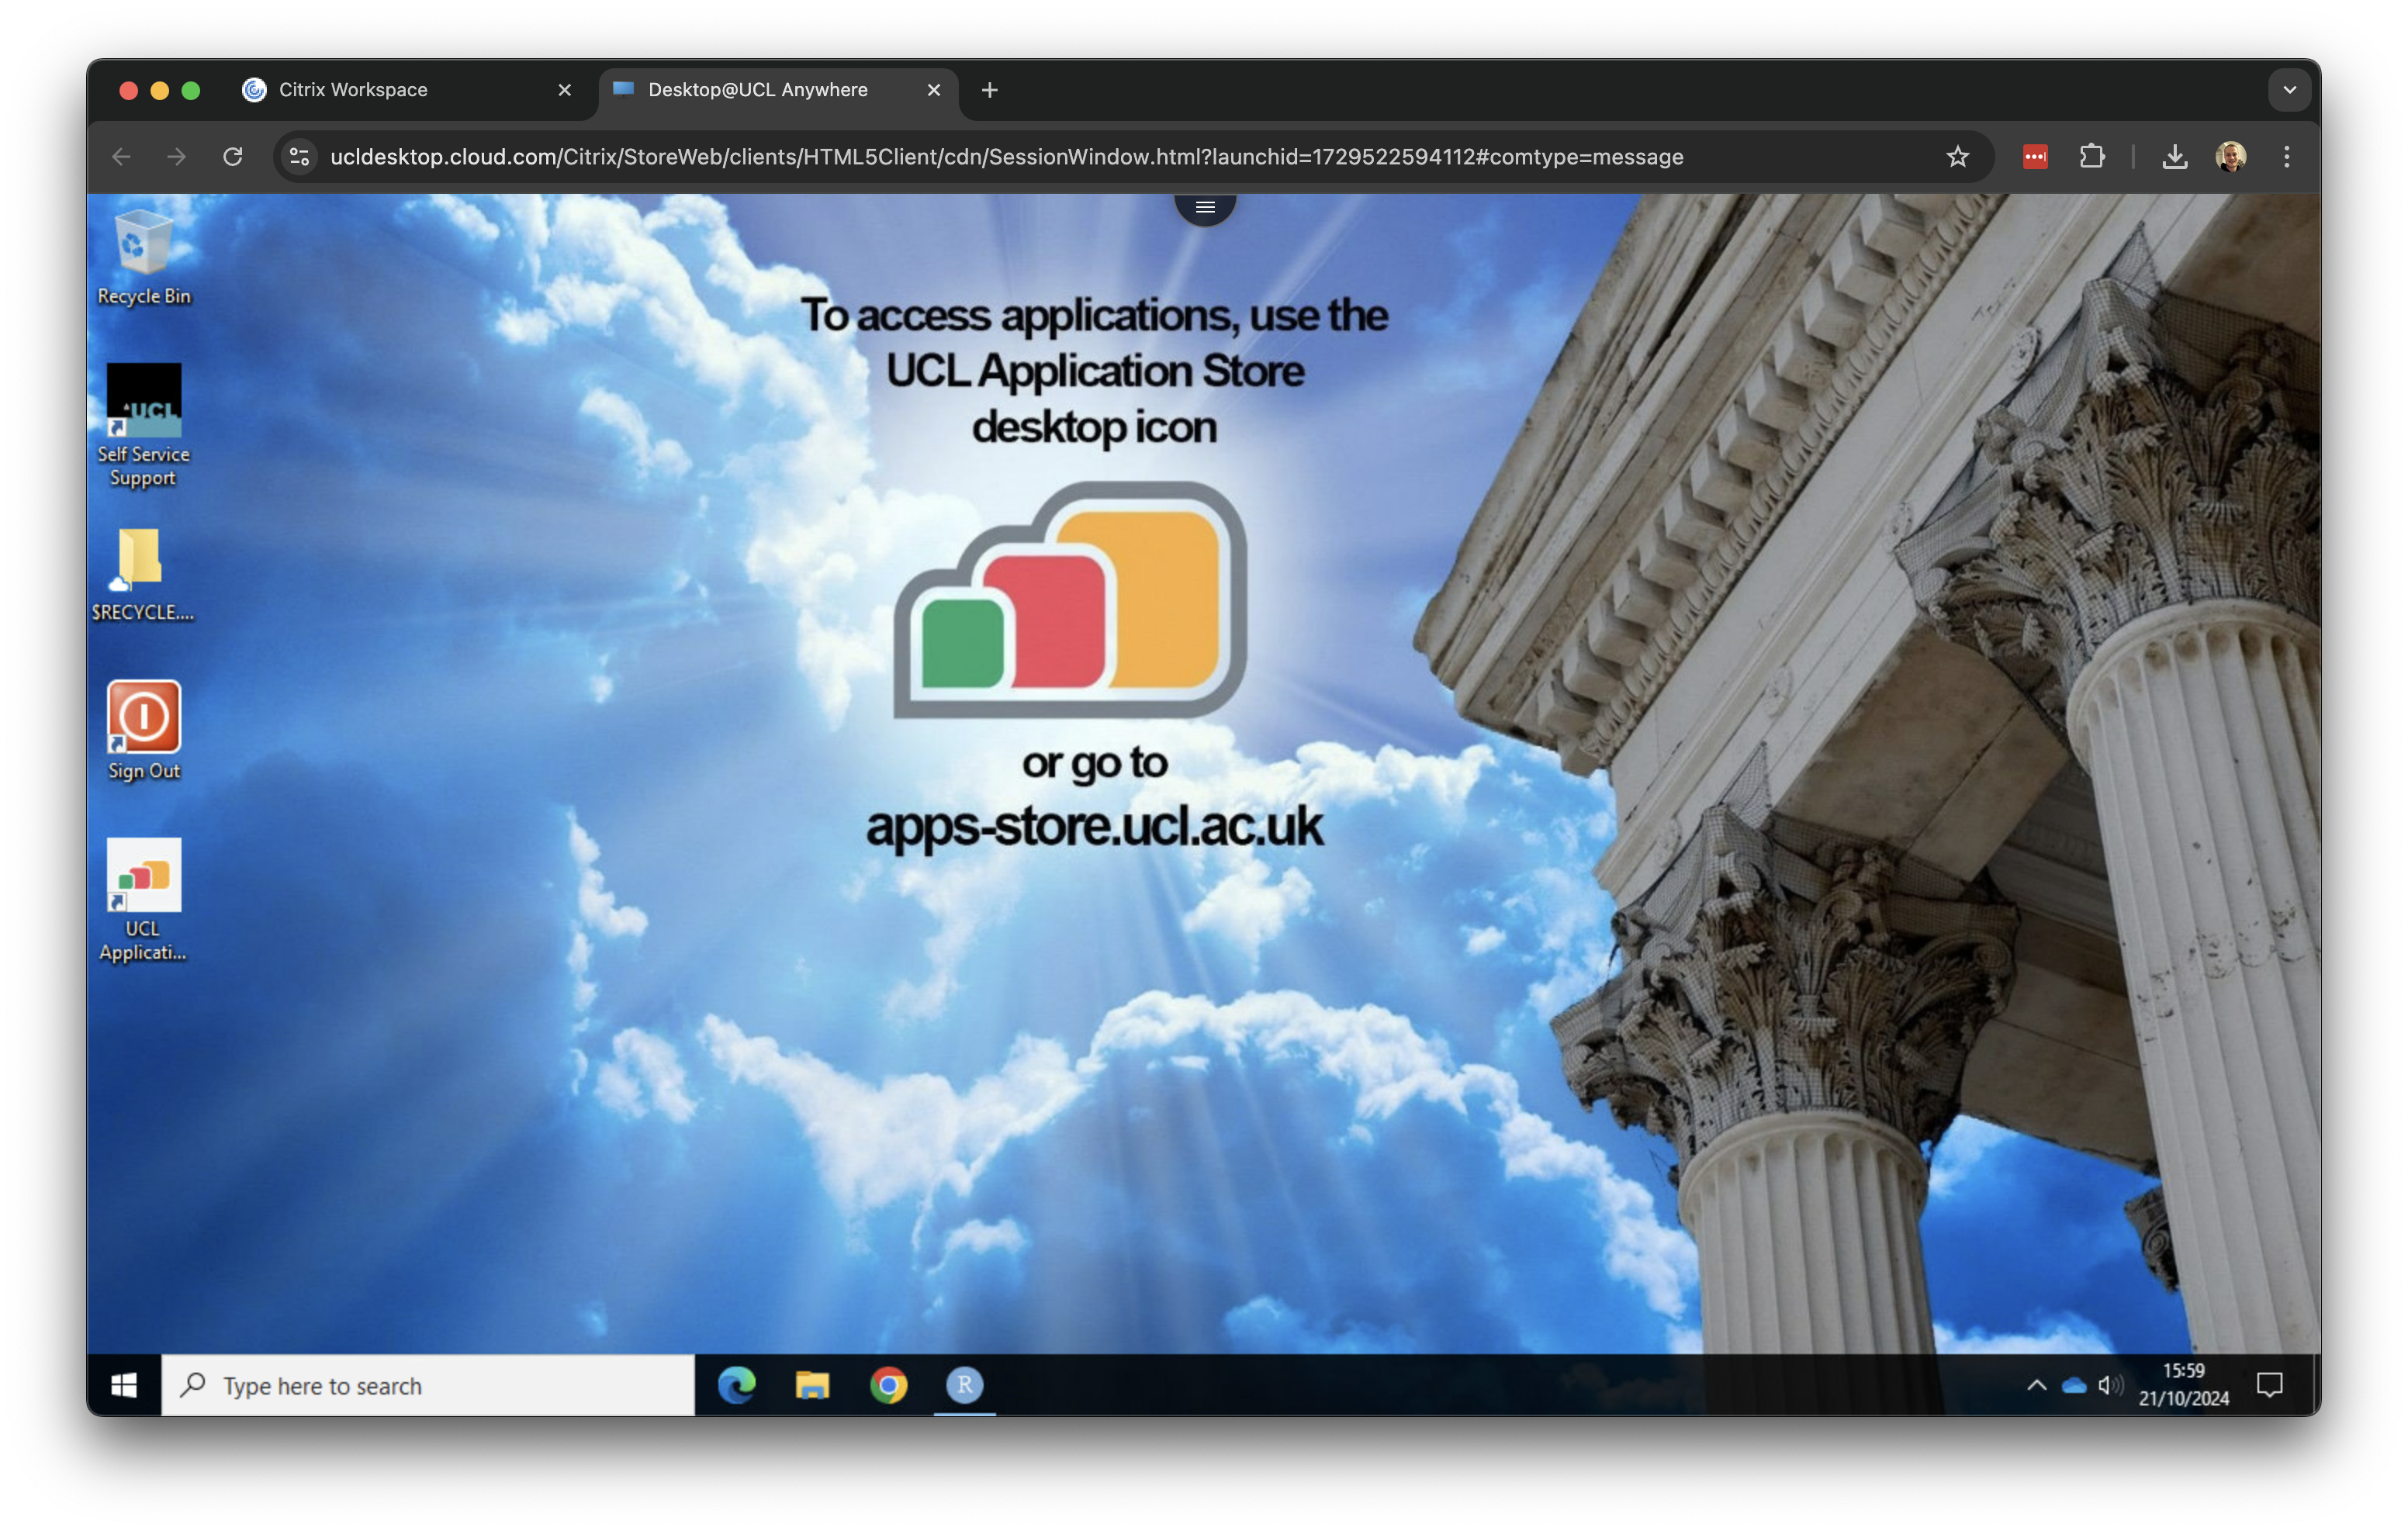
You can log in with your normal UCL username and UCL password. After this, you click on the Desktop@UCL Anywhere icon to start the service:

It may take a few minutes to load, but after this you should see your normal UCL Windows desktop:
1.2 Crime data
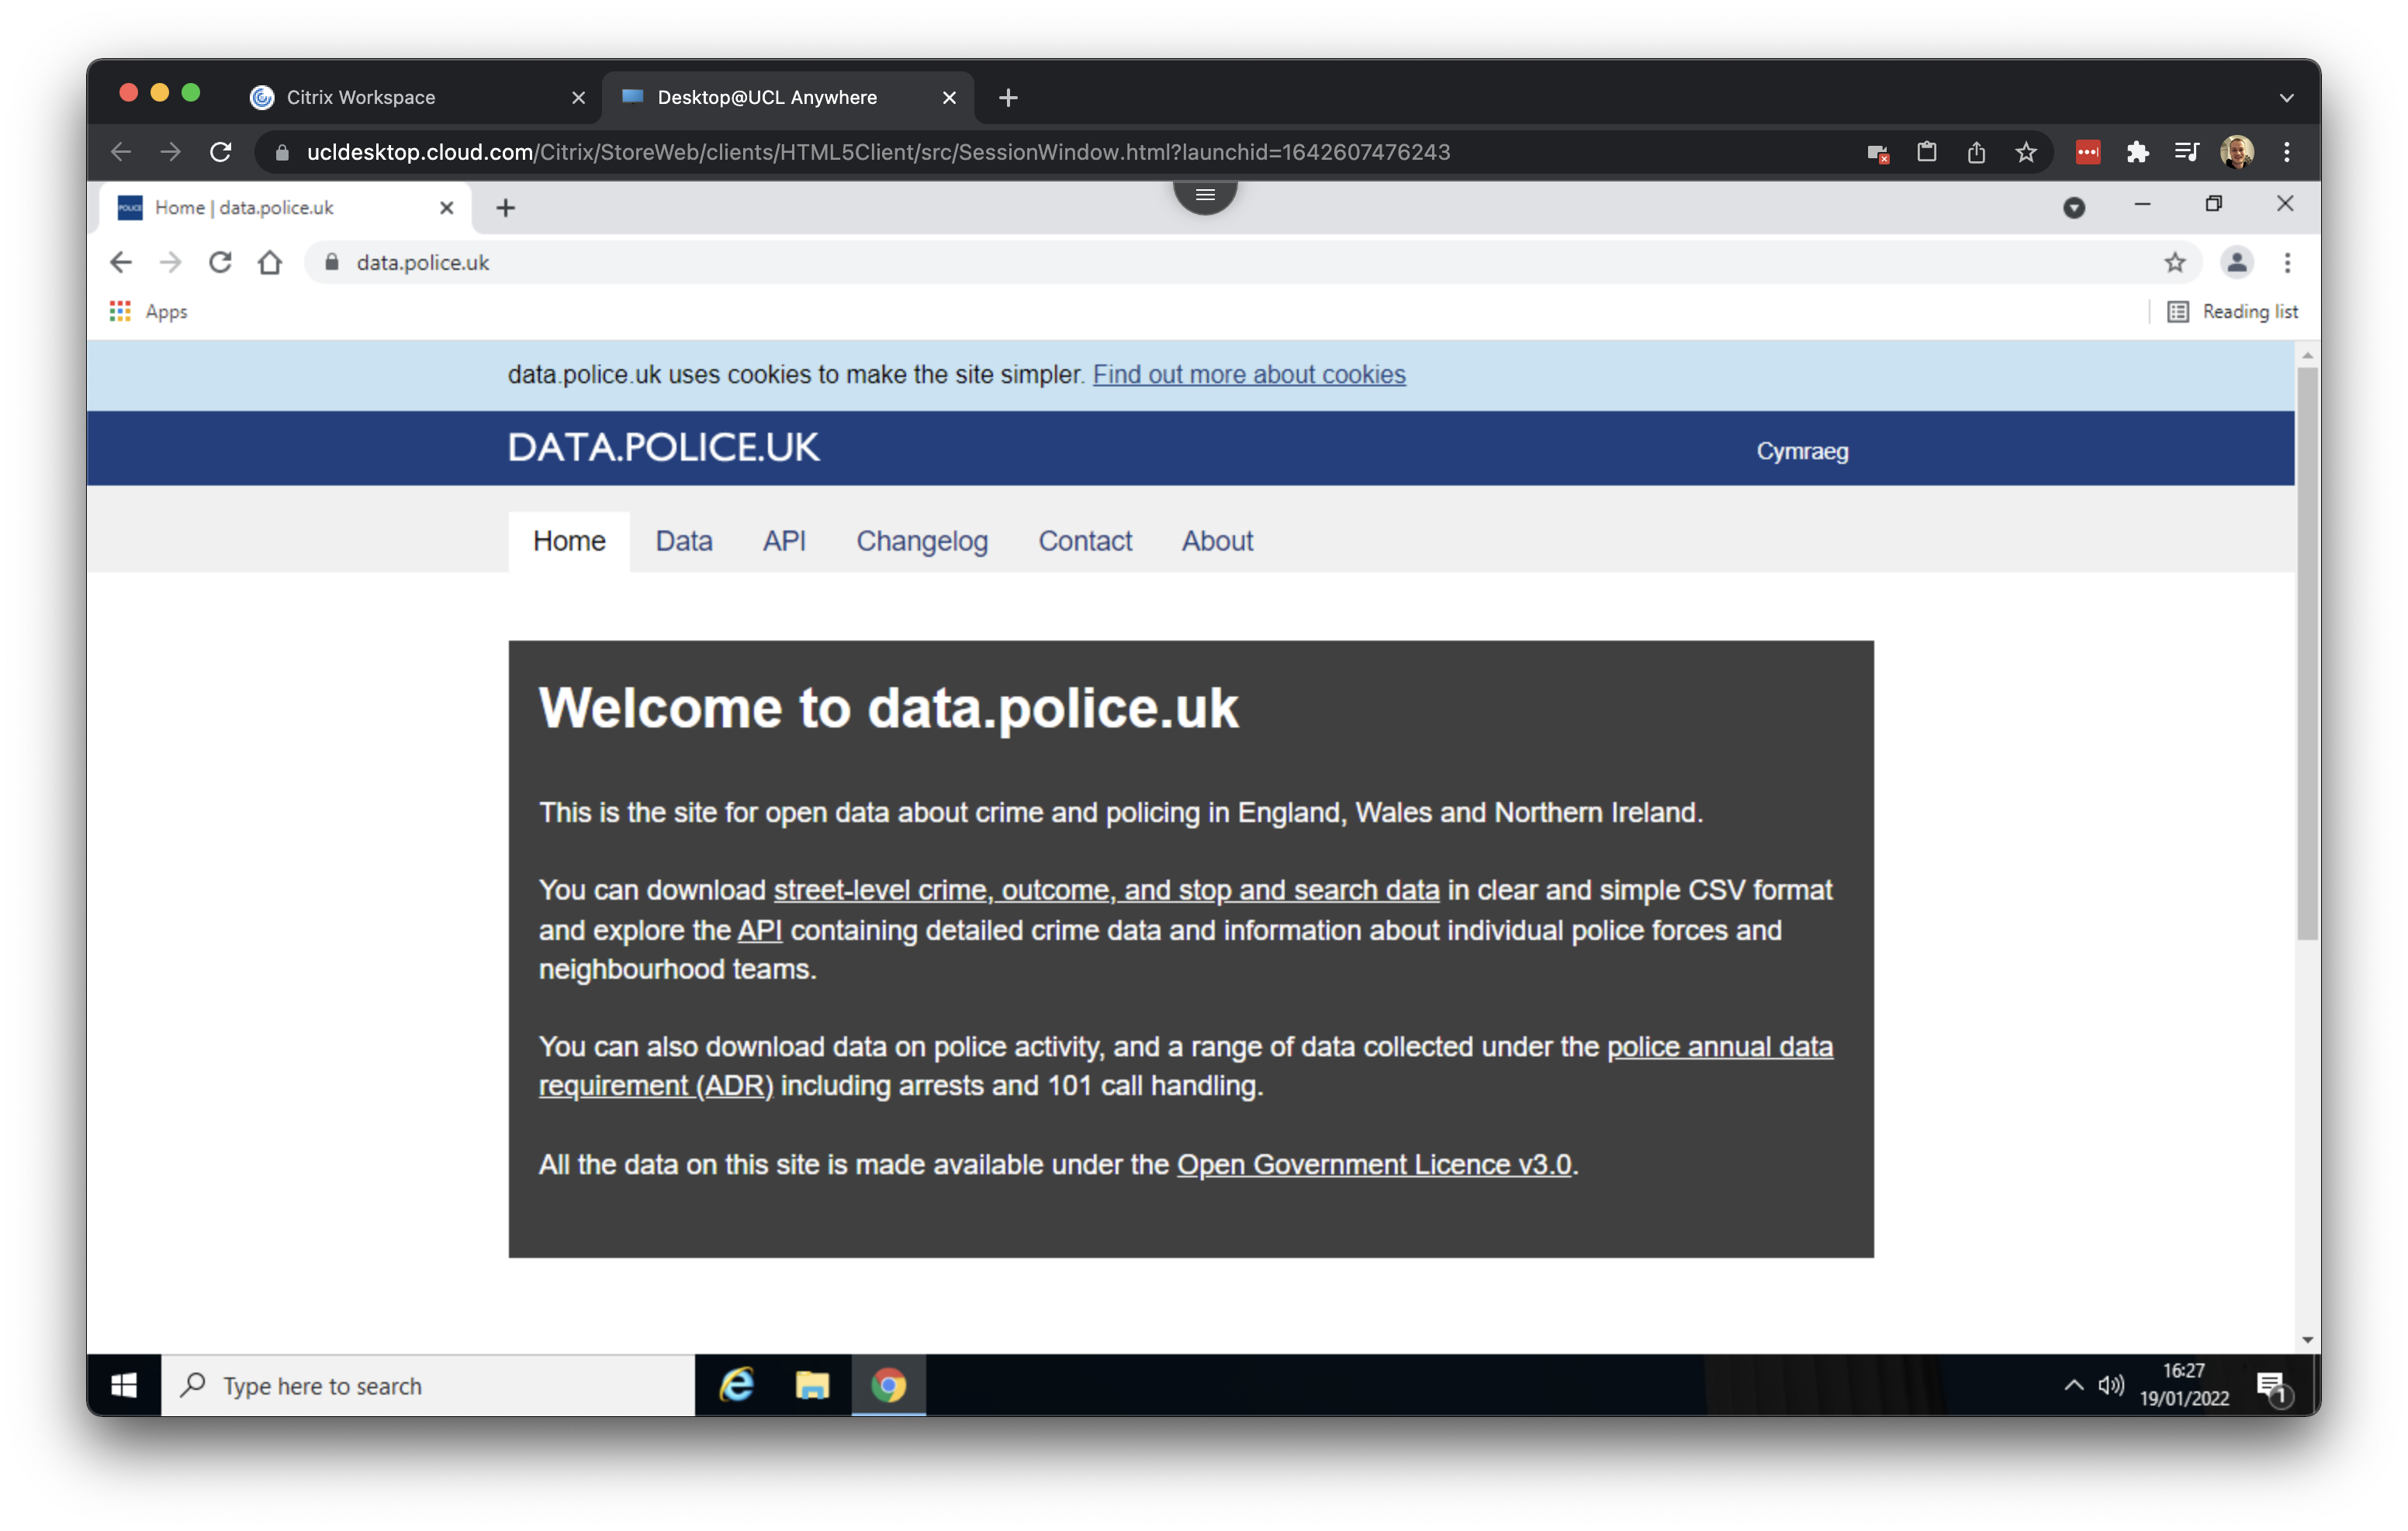
For our crime data, we will use data directly from the Police Data Portal, which you can find at data.police.uk. This Data Portal allows you to access and generate tabular data for crime recorded in the UK across the different police forces.
There are a total of 45 territorial police forces (TPFs) and 3 special police forces (SPFs) in the UK. Each TPF covers a specific geographic area, such as the West Midlands Police, while SPFs have cross-jurisdictional authority and focus on specific types of crime, like the British Transport Police. Therefore, when downloading data for a particular area, it is important to identify which police force is responsible for that region.
When you look to download crime data for London, for example, there are two territorial police forces working within the city and its greater metropolitan area:
- The Metropolitan Police, which covers nearly the entire Greater London area.
- The City of London Police, which covers the City of London.
Today we will leave the City of London for what it is because we will look at crime hotspots in the London boroughs of Camden and Islington. To download the data we will need, open Google Chrome (within your Desktop@UCL environment) and navigate to data.police.uk.
You can use any browser to download files, but note that the specific steps might vary slightly depending on the browser you choose.
Click on Downloads and subsequently select November 2023 to November 2023 as data range and tick the box for the Metropolitan Police Service. With this selection we can download all crime data recorded by the Metropolitan Police Services for the month of November 2023
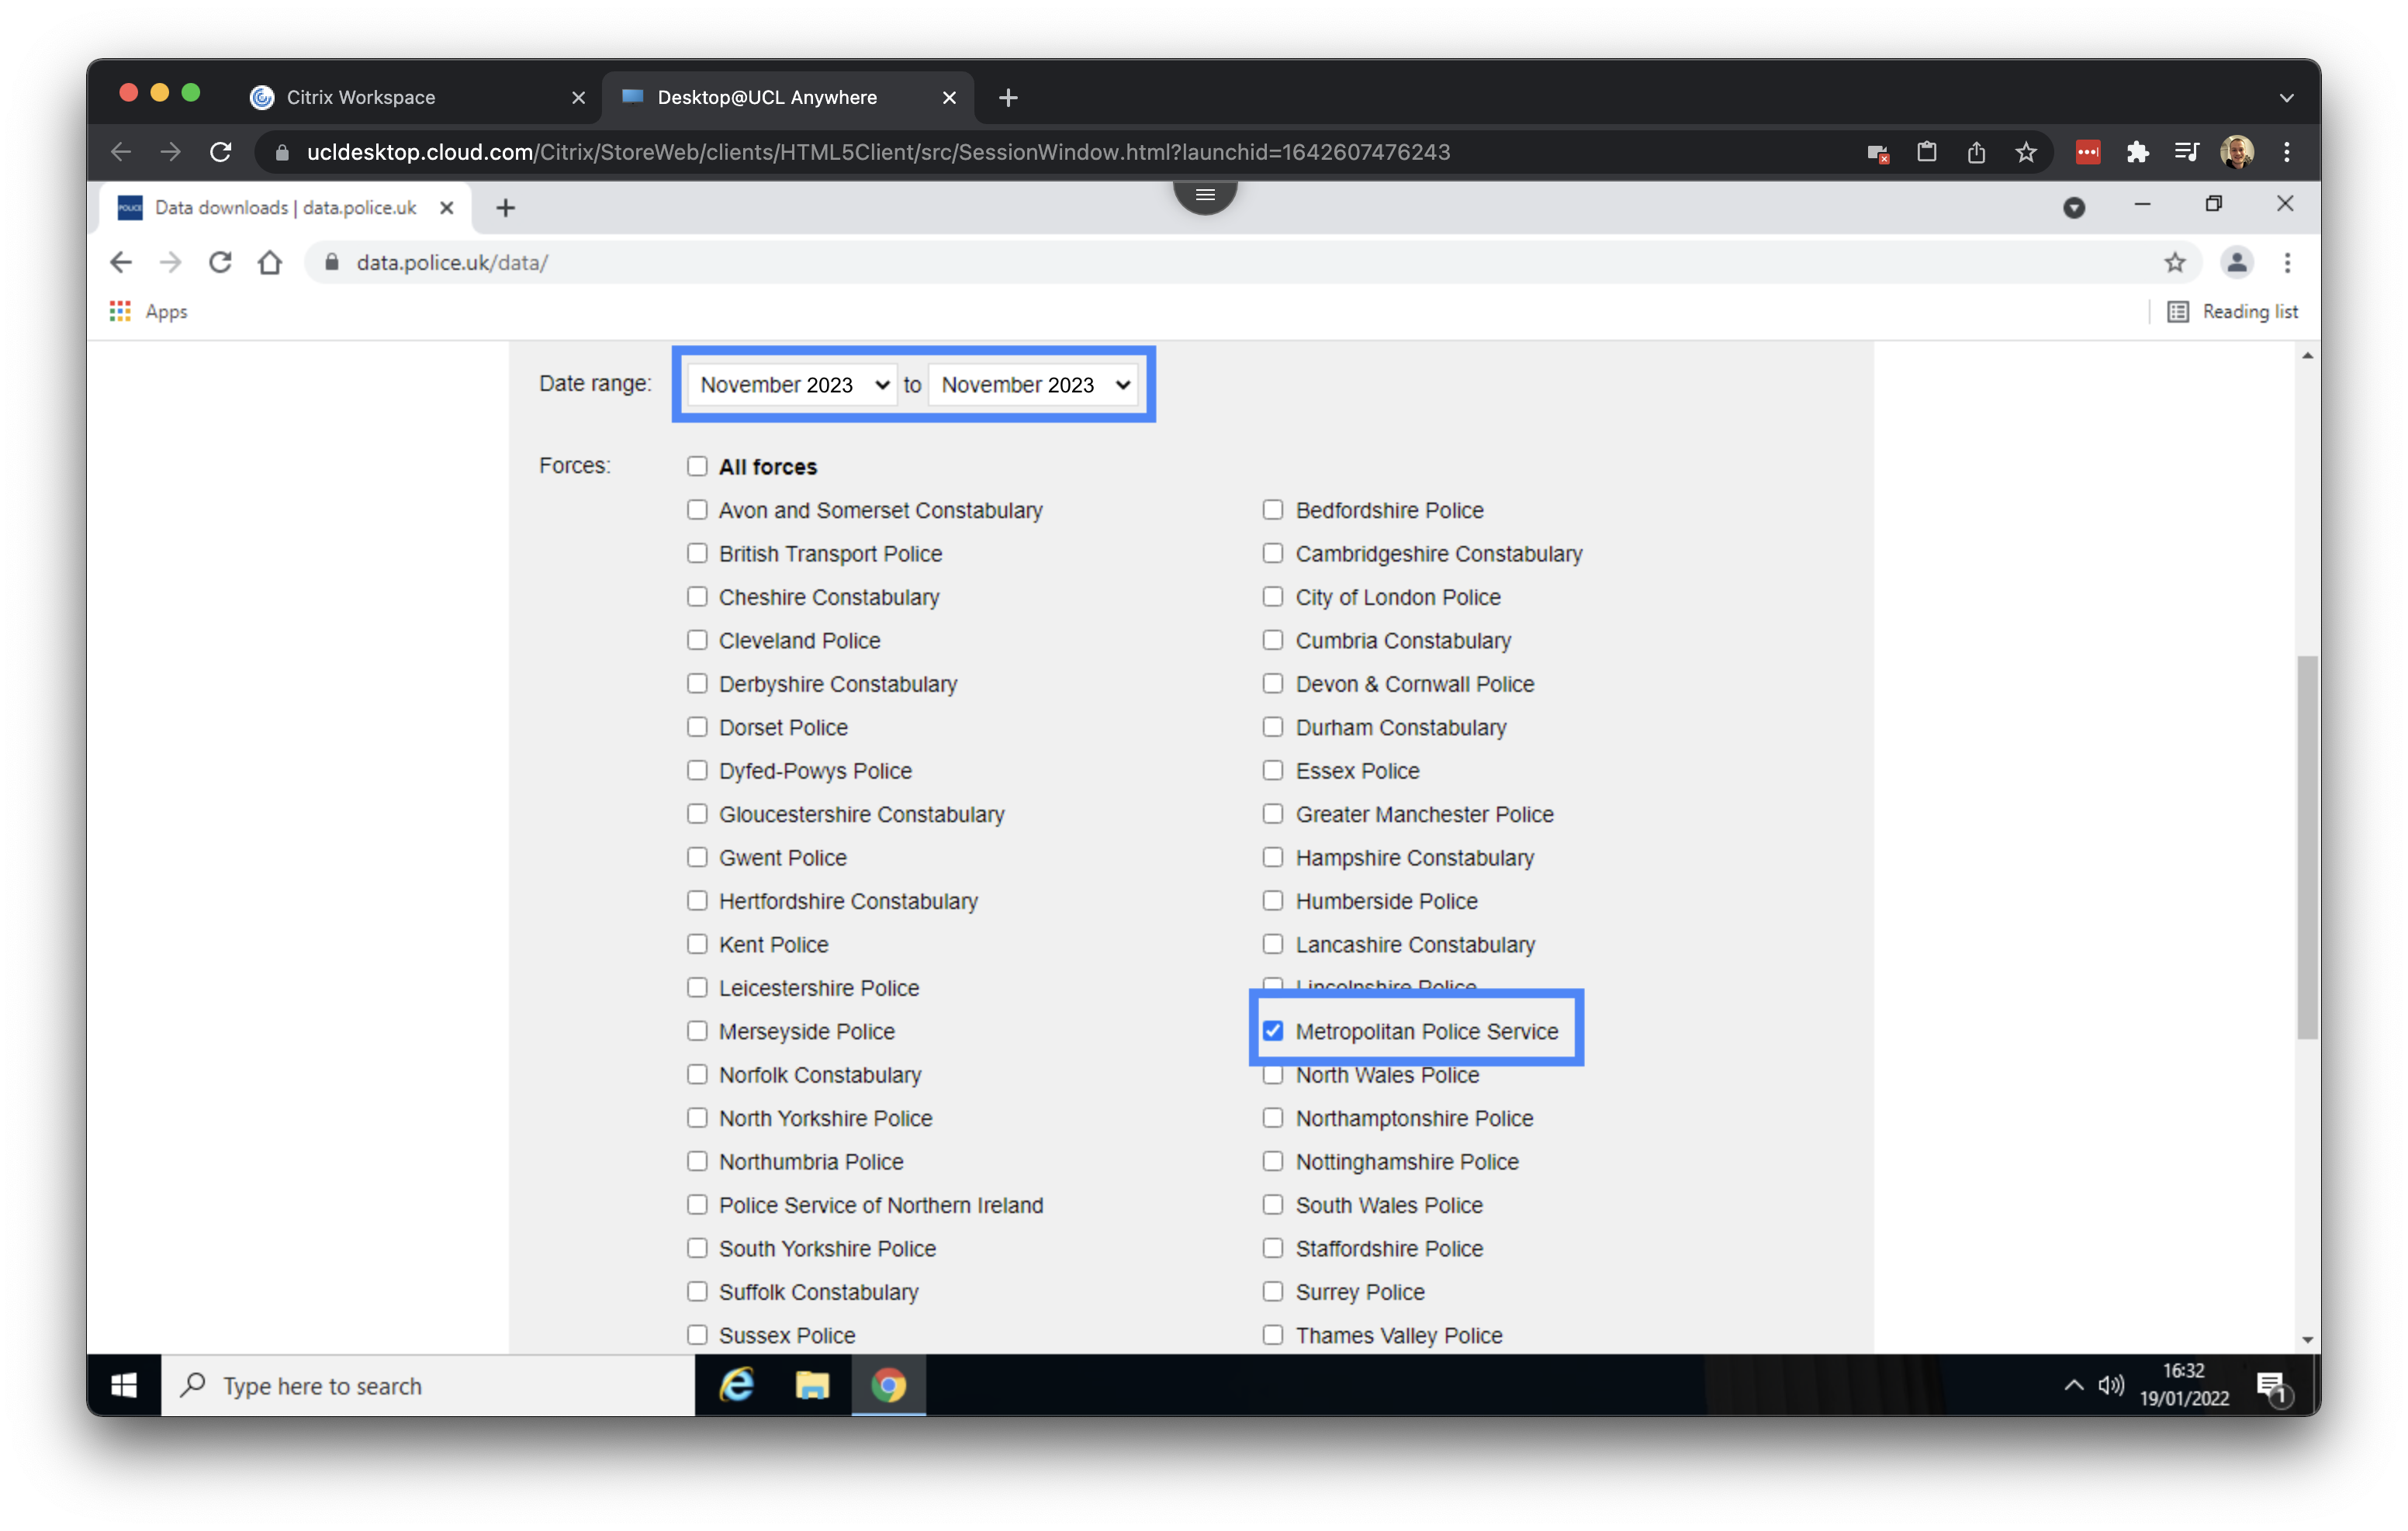
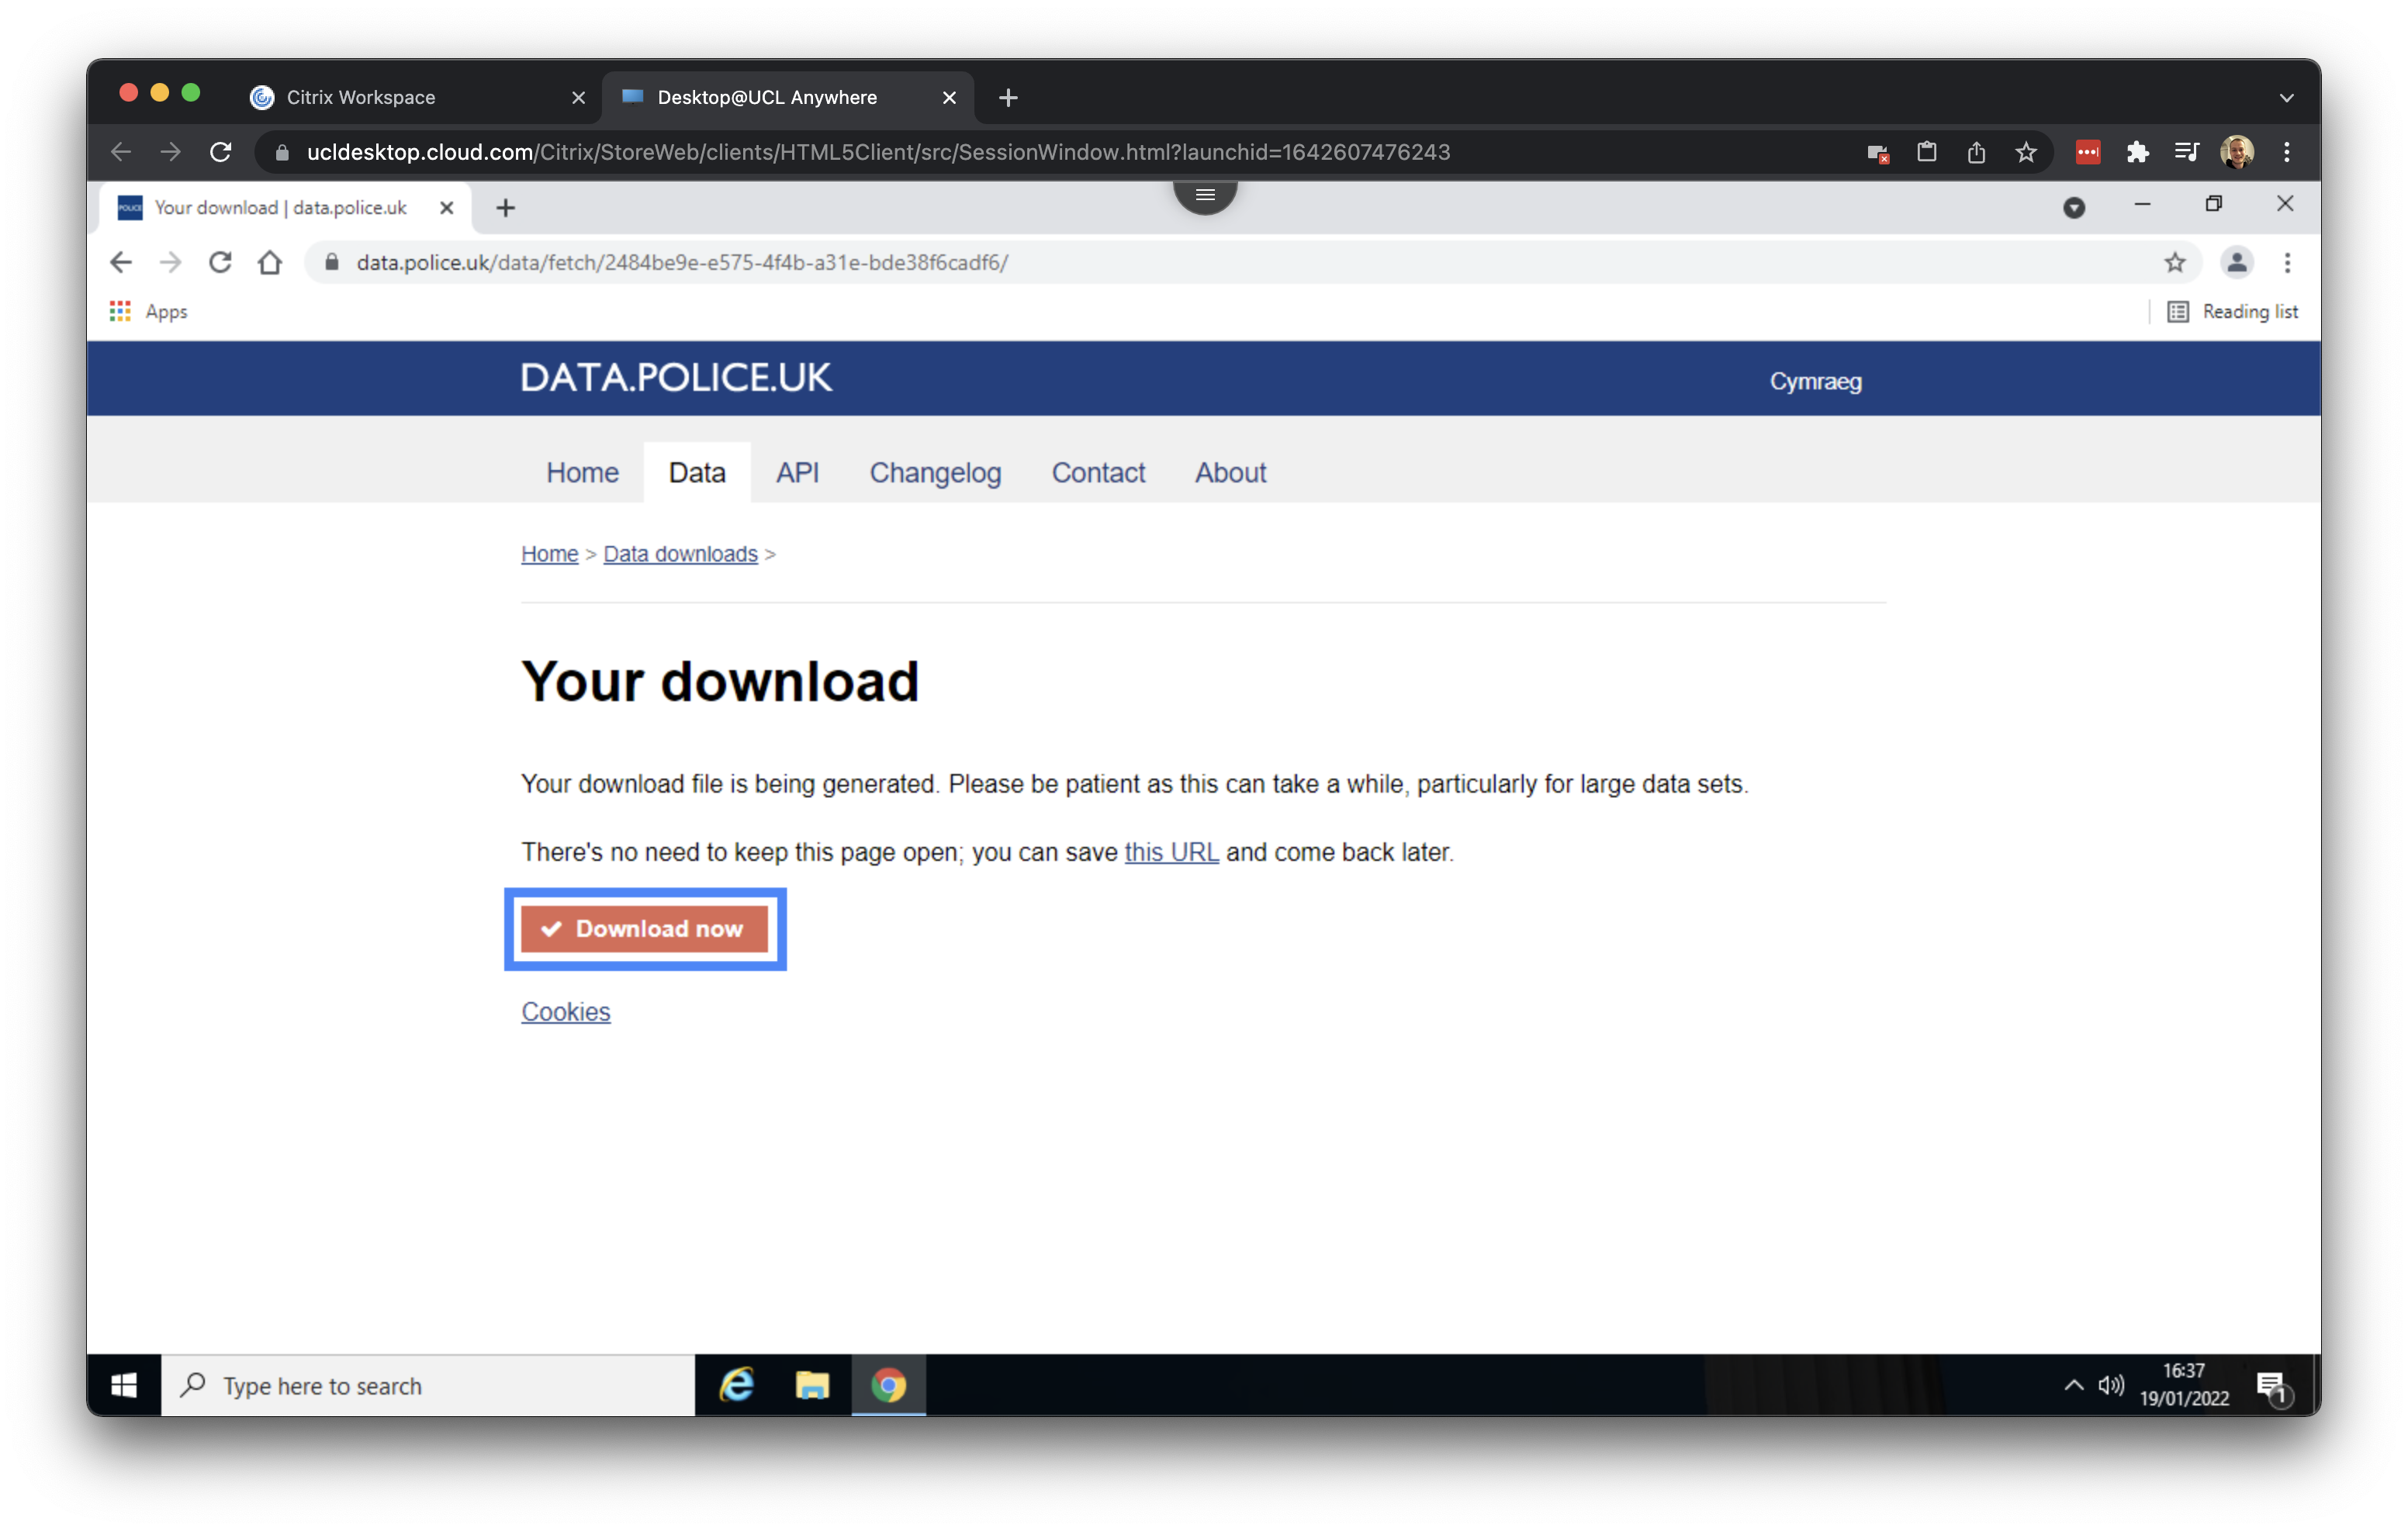
Make sure that the box in front of Include crime data is ticked and proceed to click on Generate file. Once your file is generated you can click on Download now.
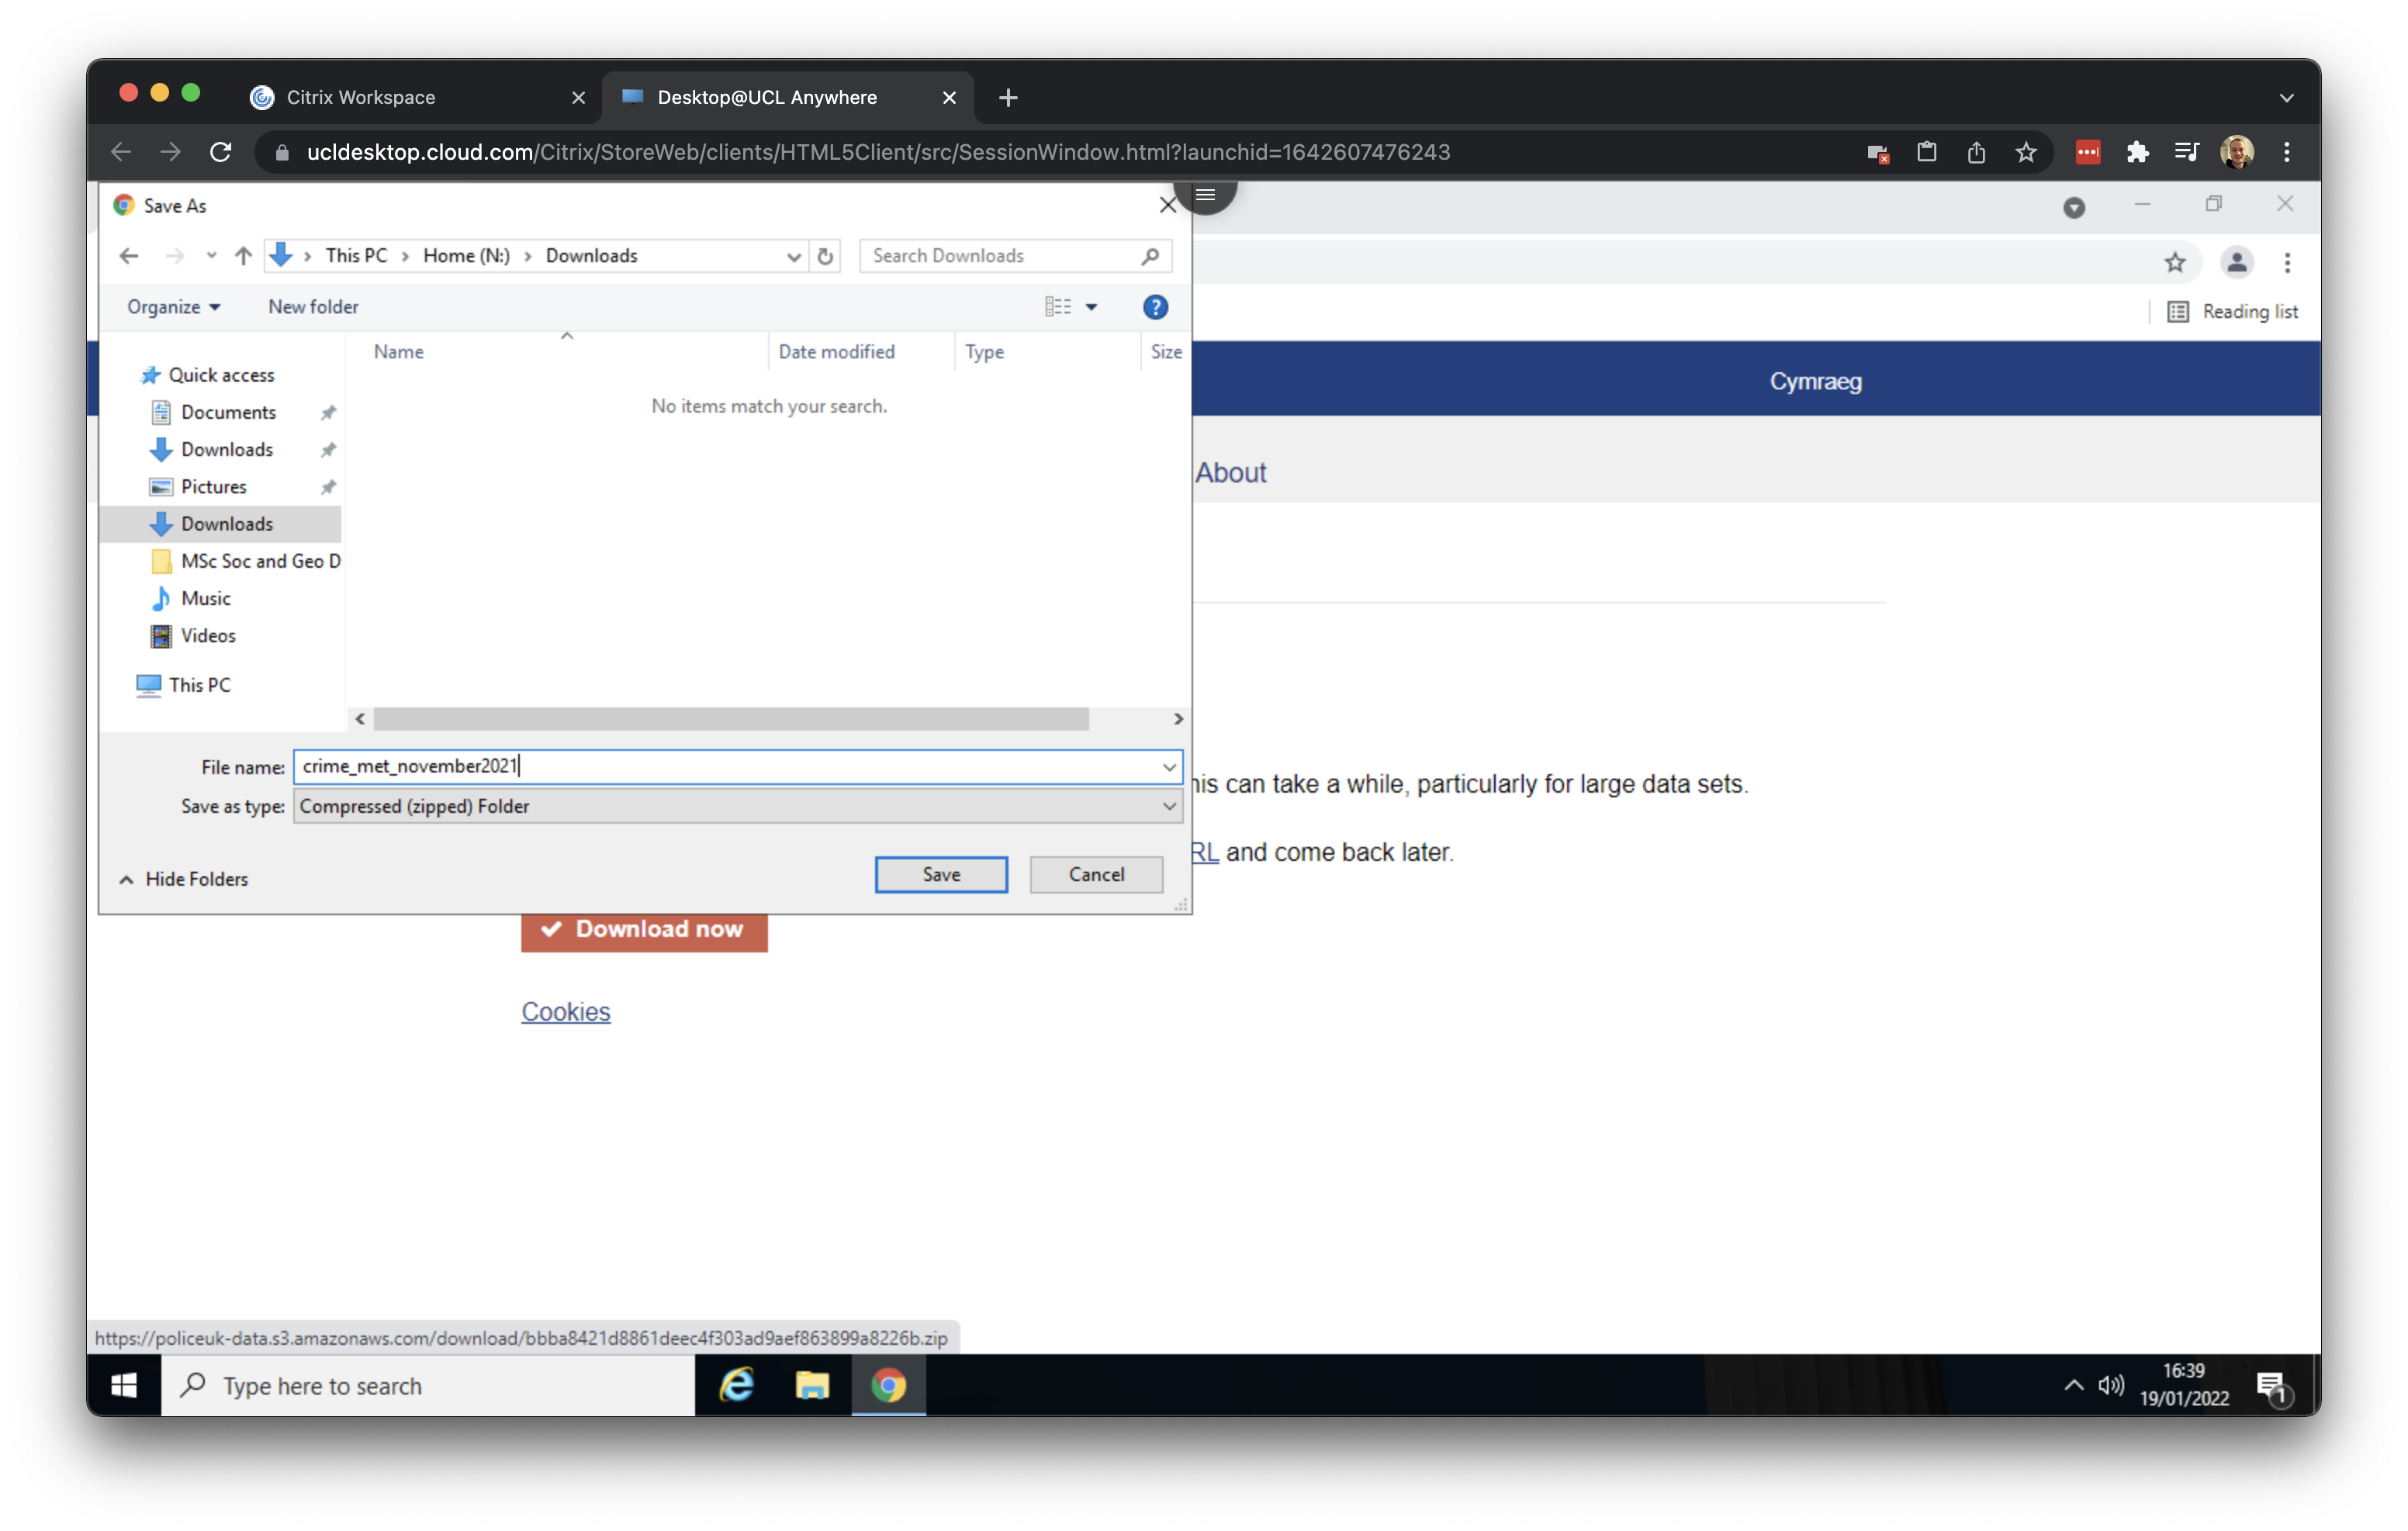
Save the file as crime_met_november2023 in your Downloads folder.
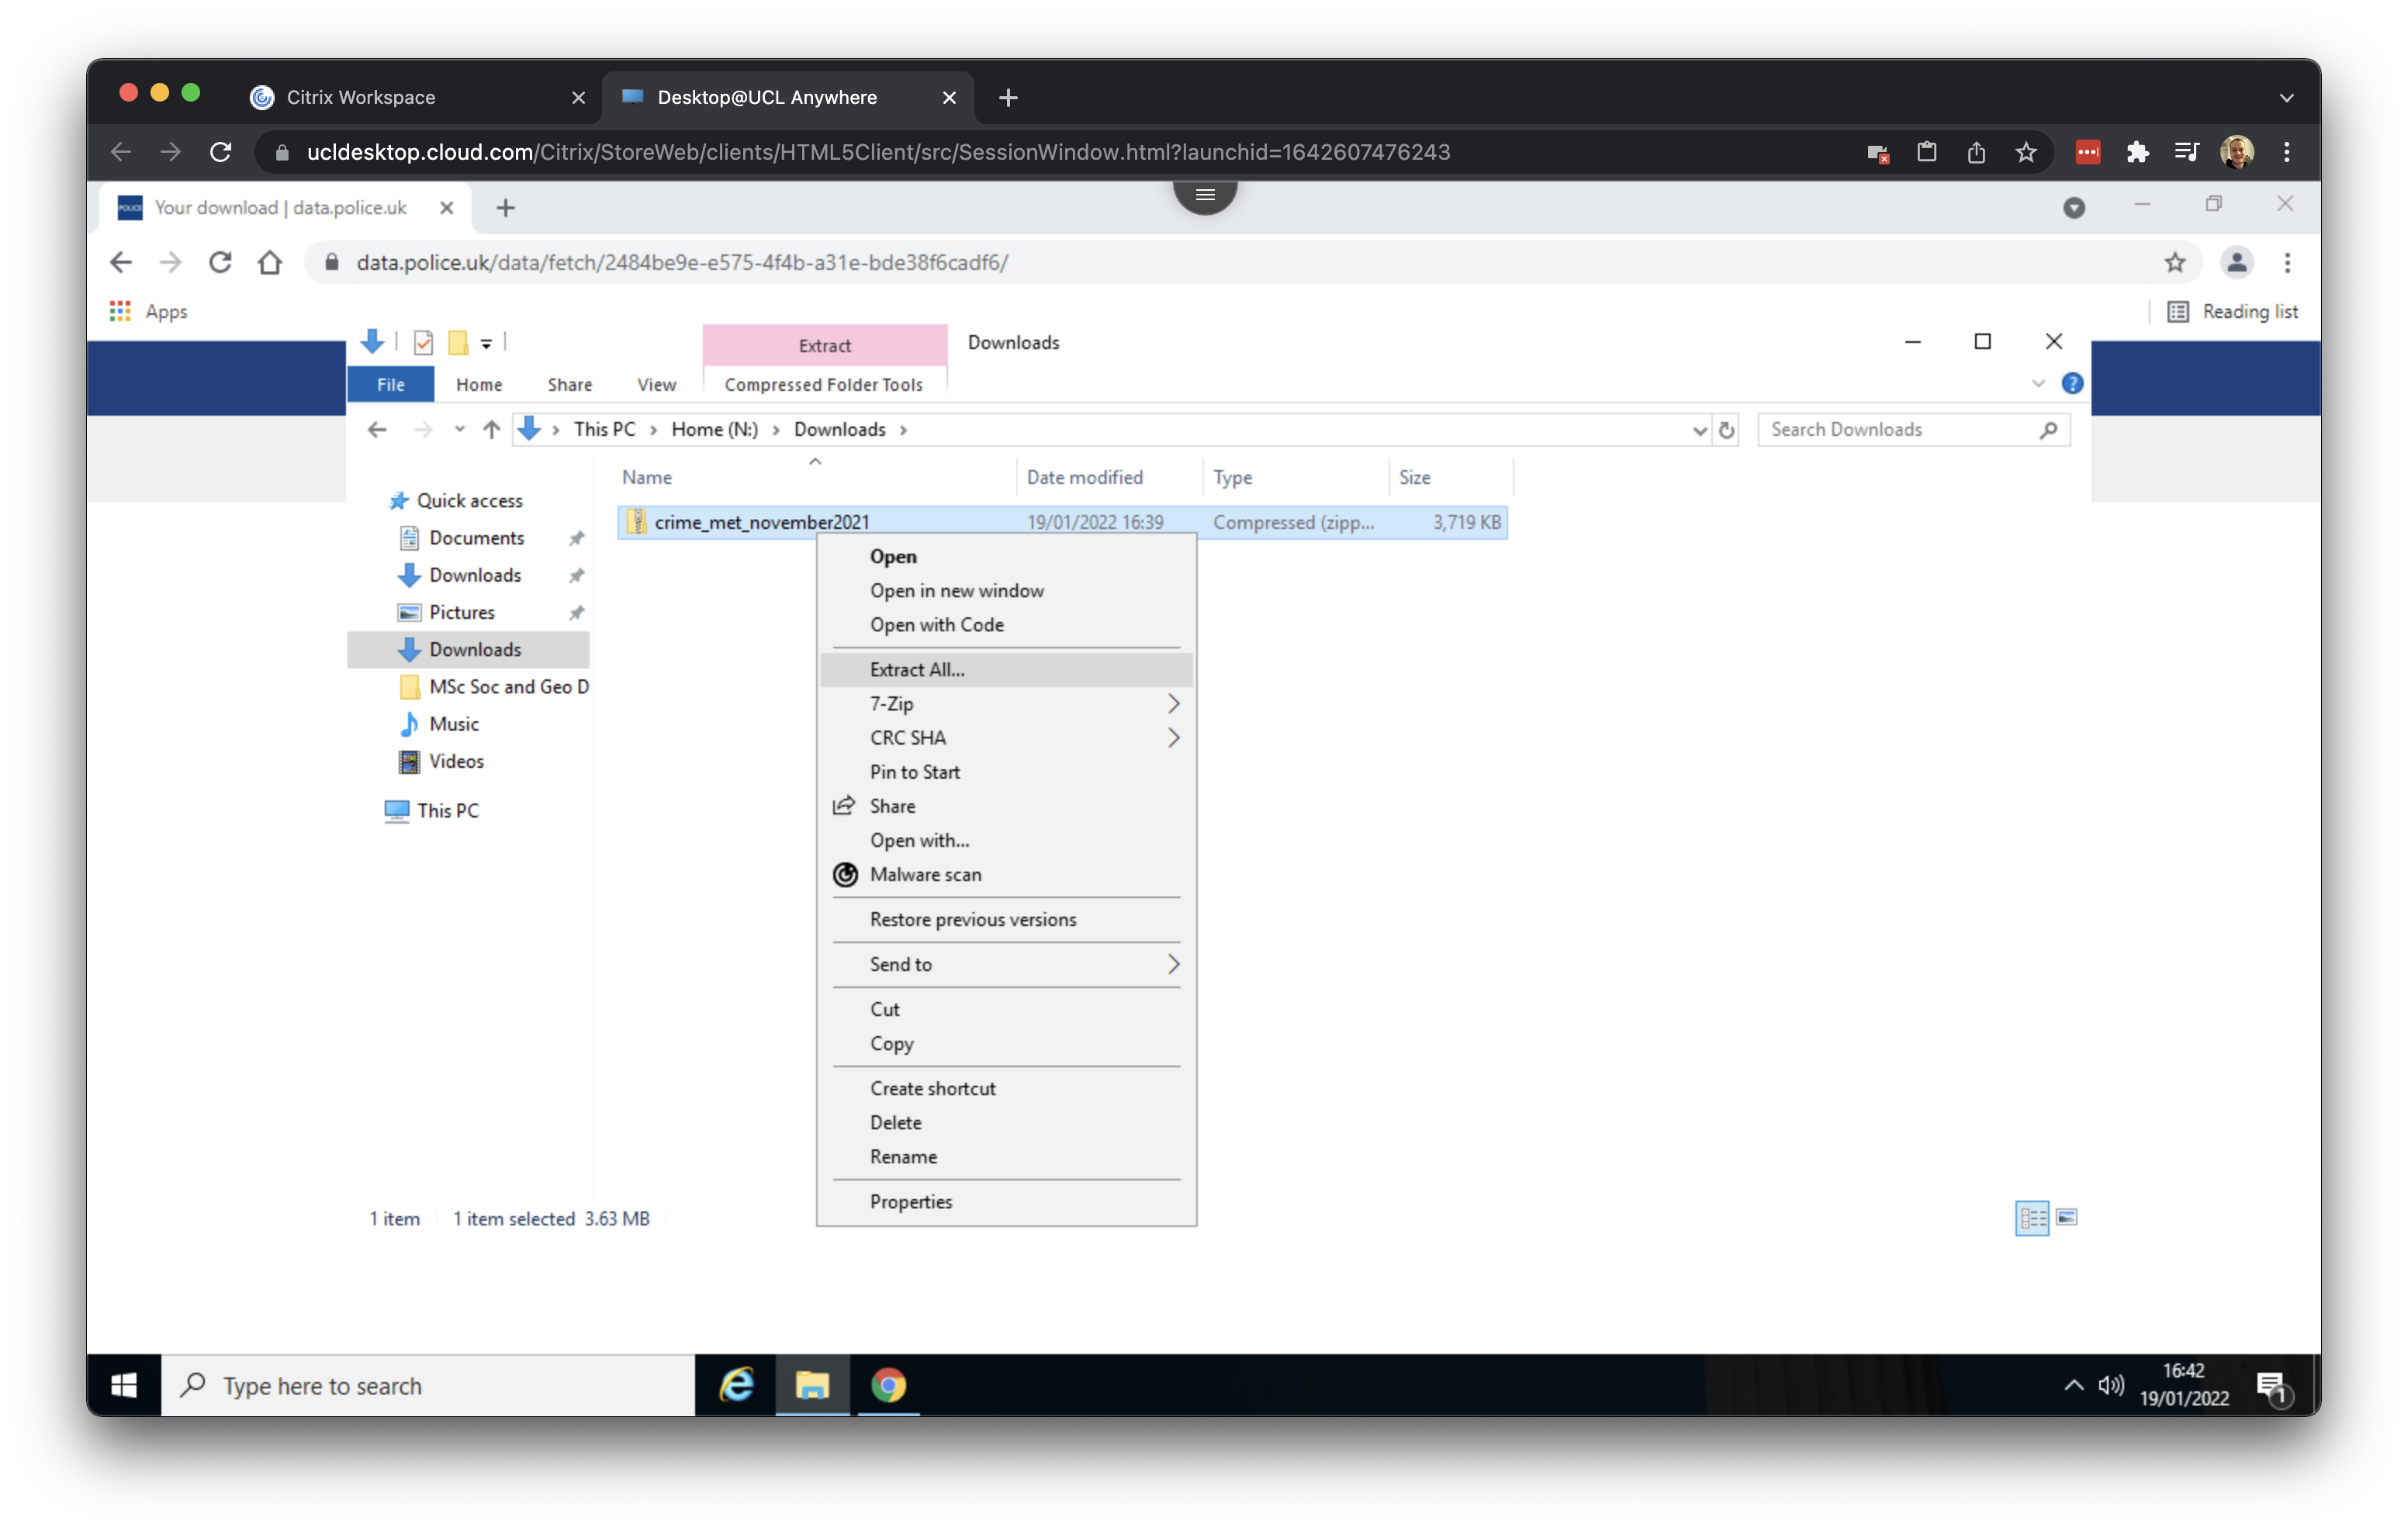
Your download should complete within seconds. Once it is finished, navigate to your Downloads, right click on the crime_met_november2023.zip folder, and select Extract All. This will unpack the compressed data, making it ready for use in QGIS later.
1.3 Reference data
Now we have downloaded the crime data, we need to download some background and reference data. Two data sets are available on Moodle: the boundaries of the boroughs in London as well as the London road network.
Within your UCL Desktop environment, navigate to the Geography in the Field II Moodle page and scroll down to Week 8: Mapping London.
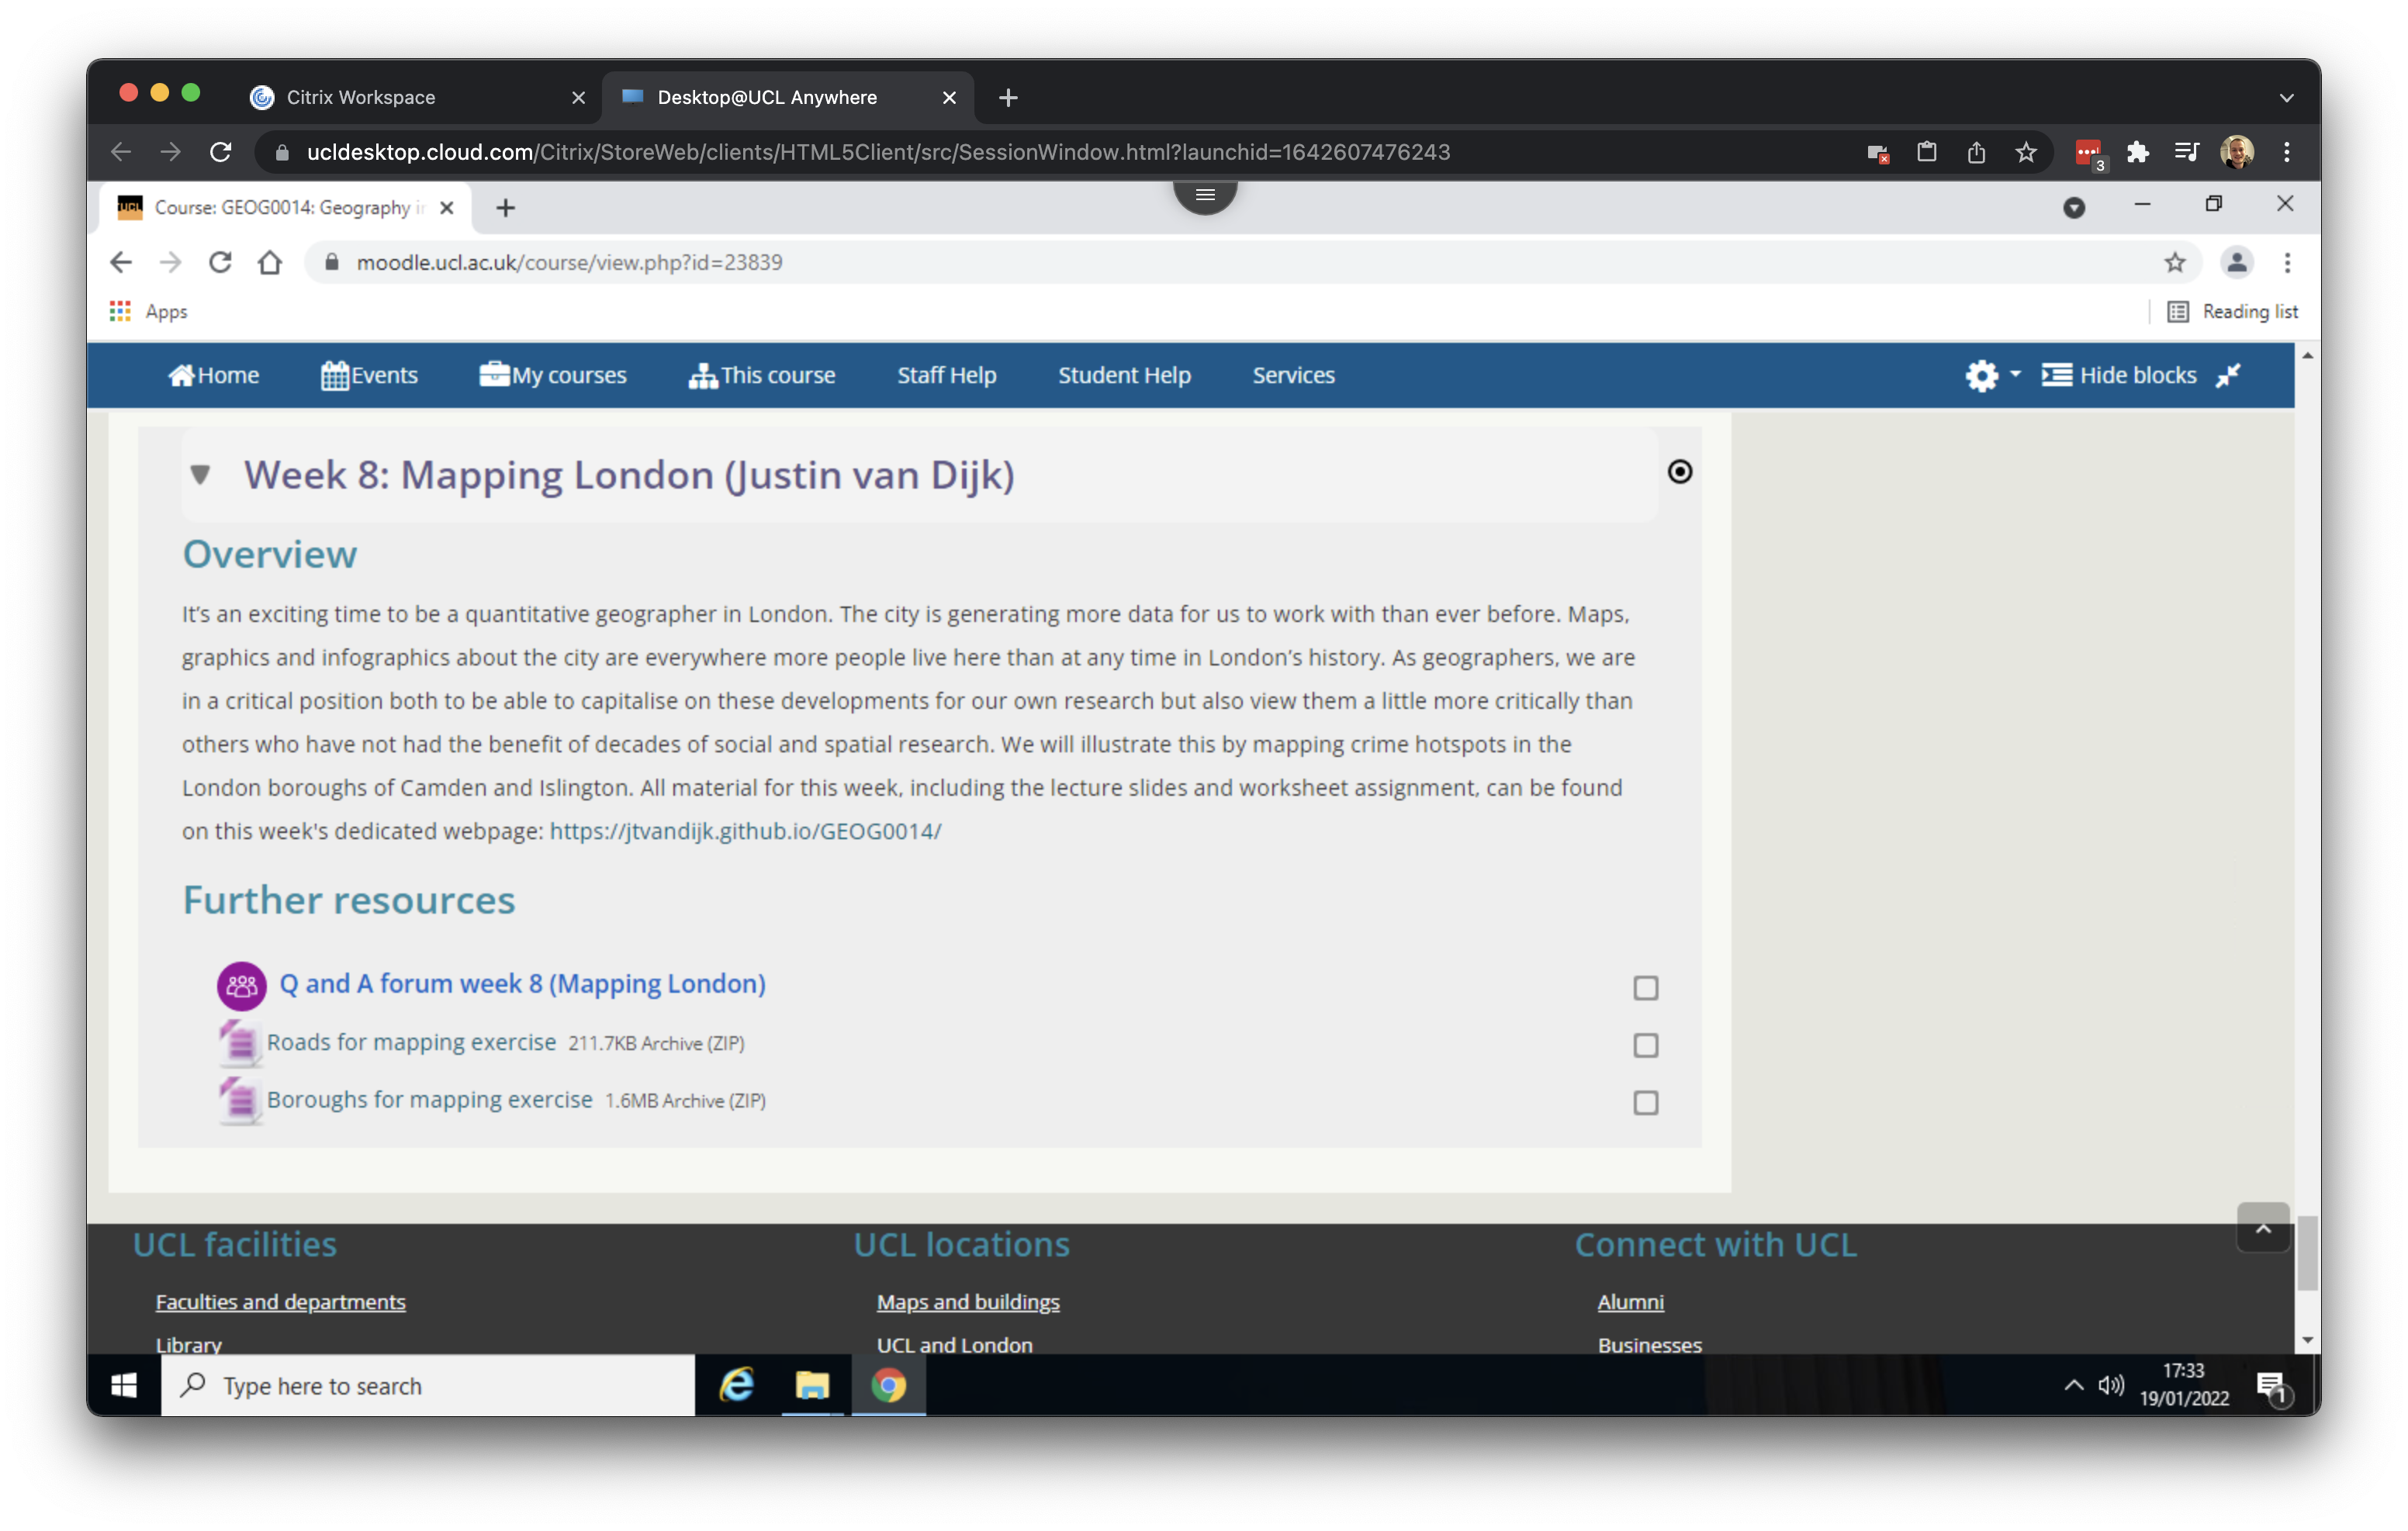
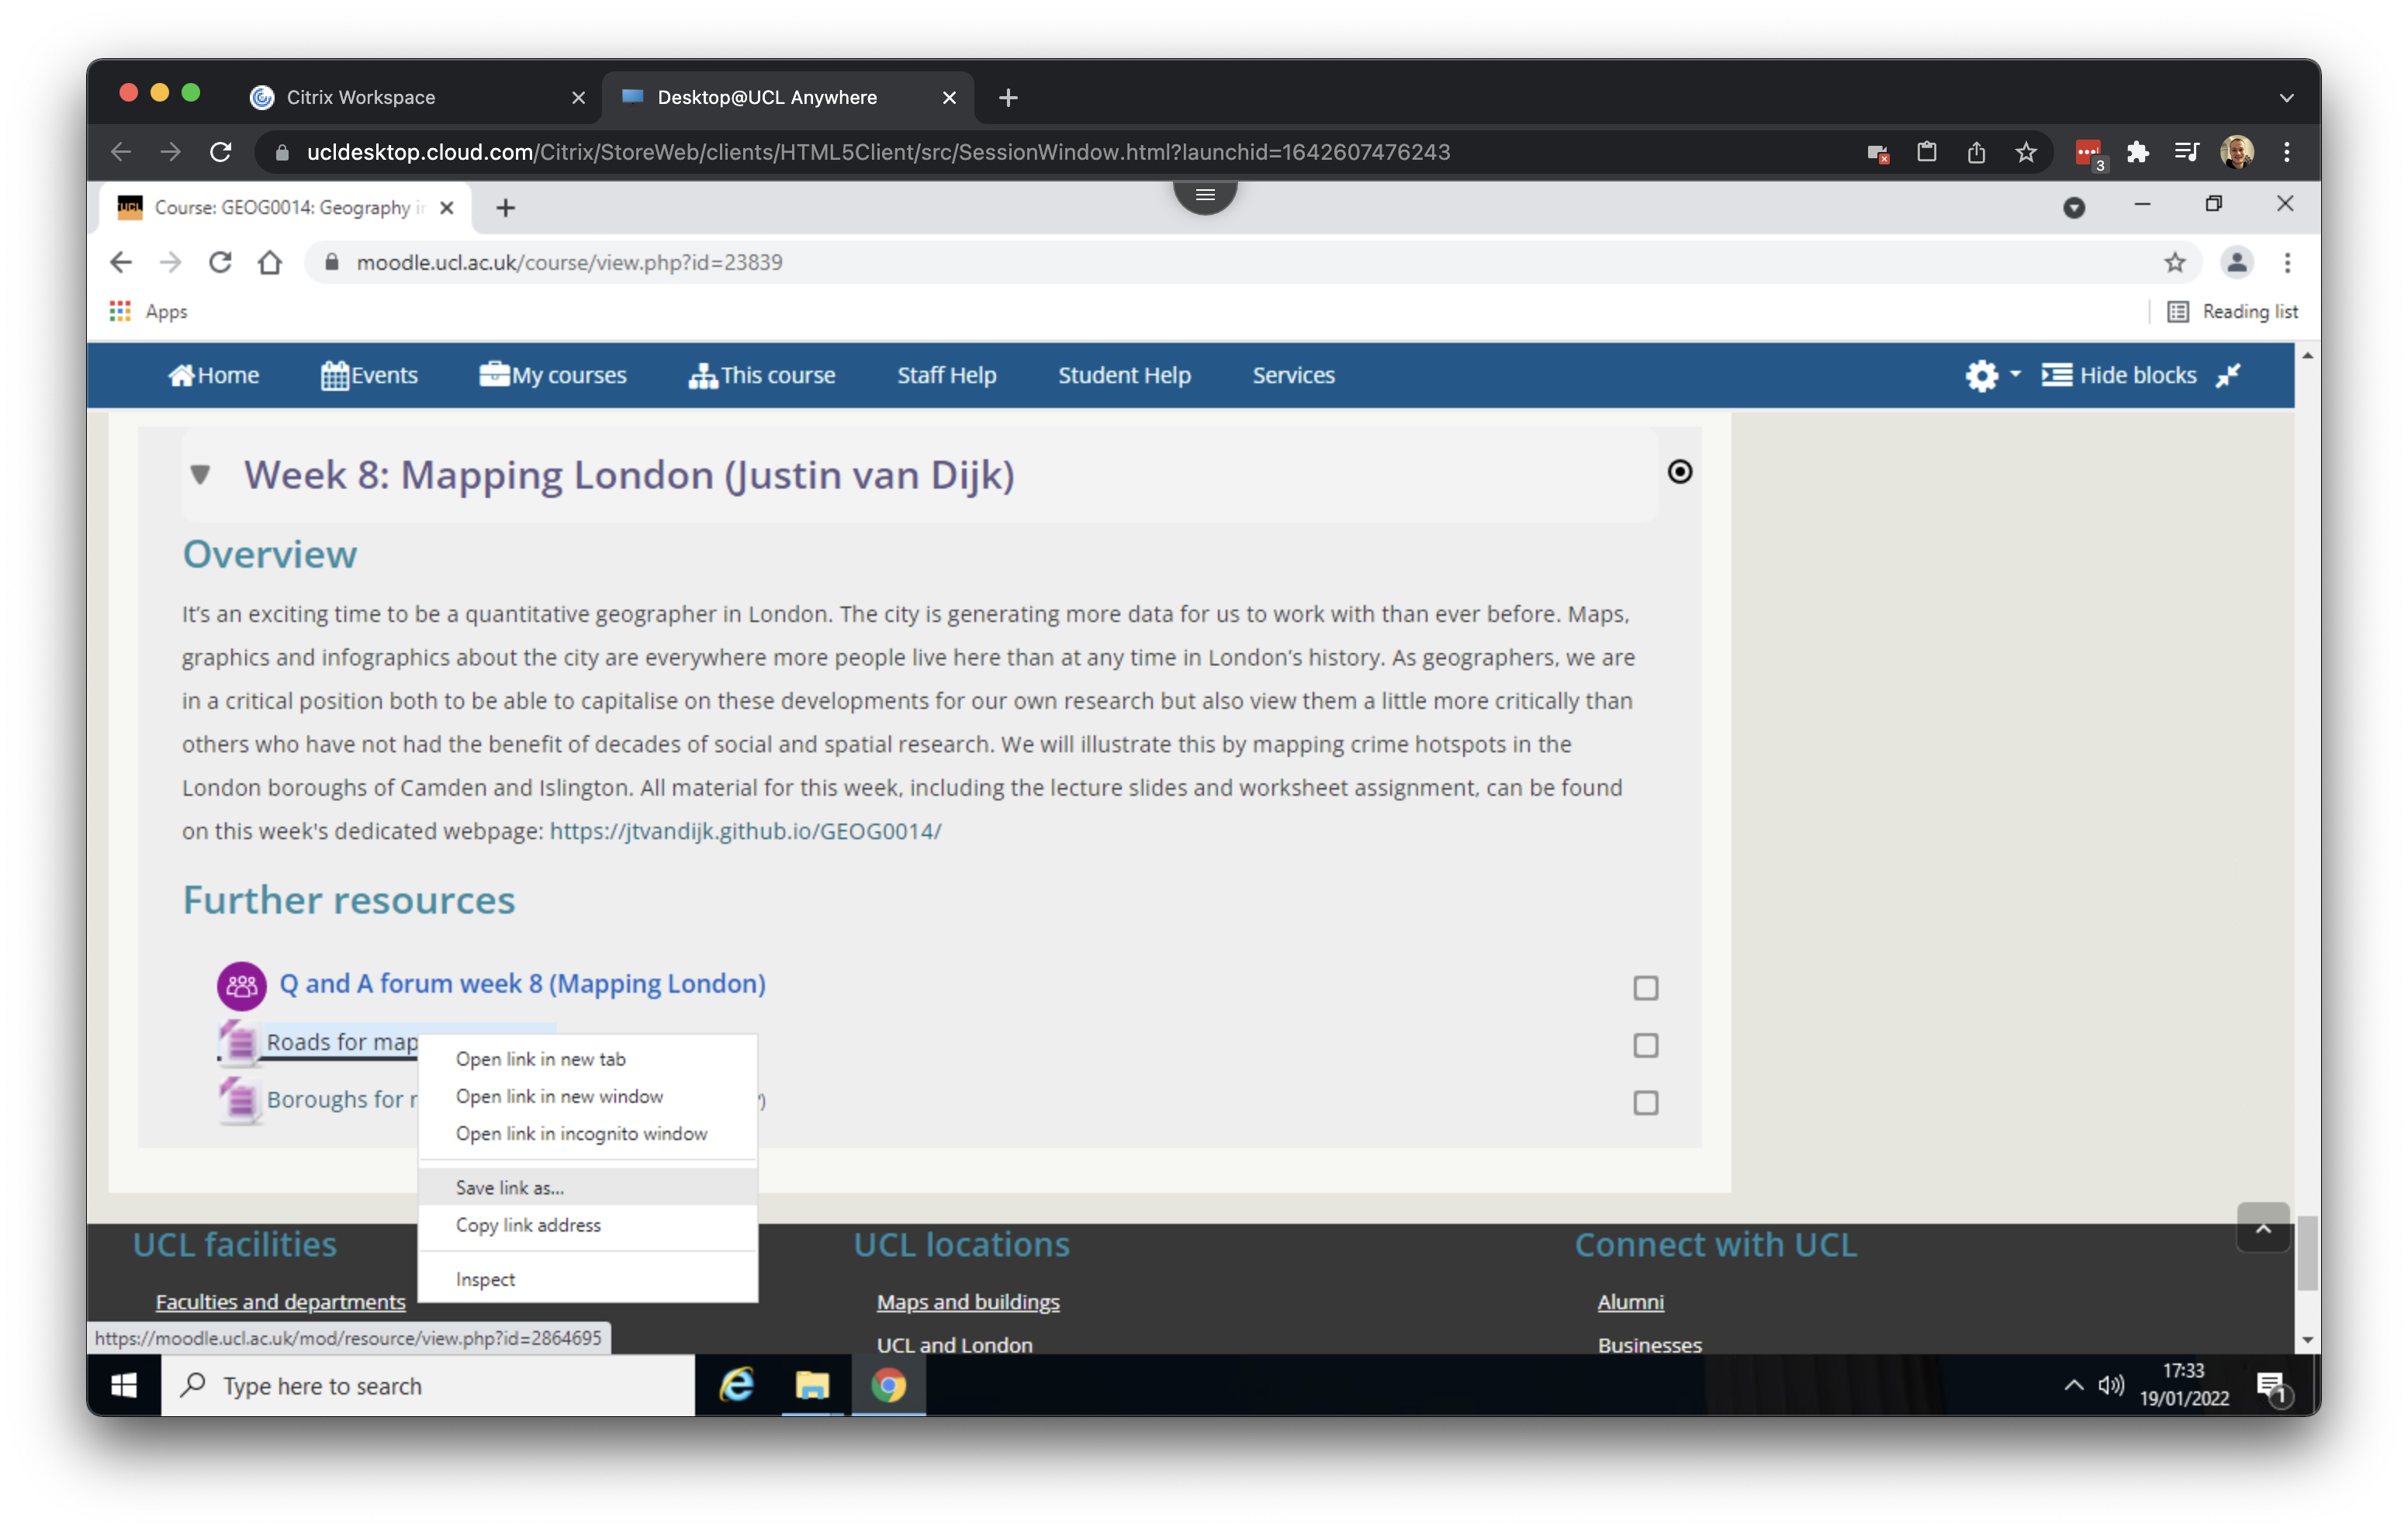
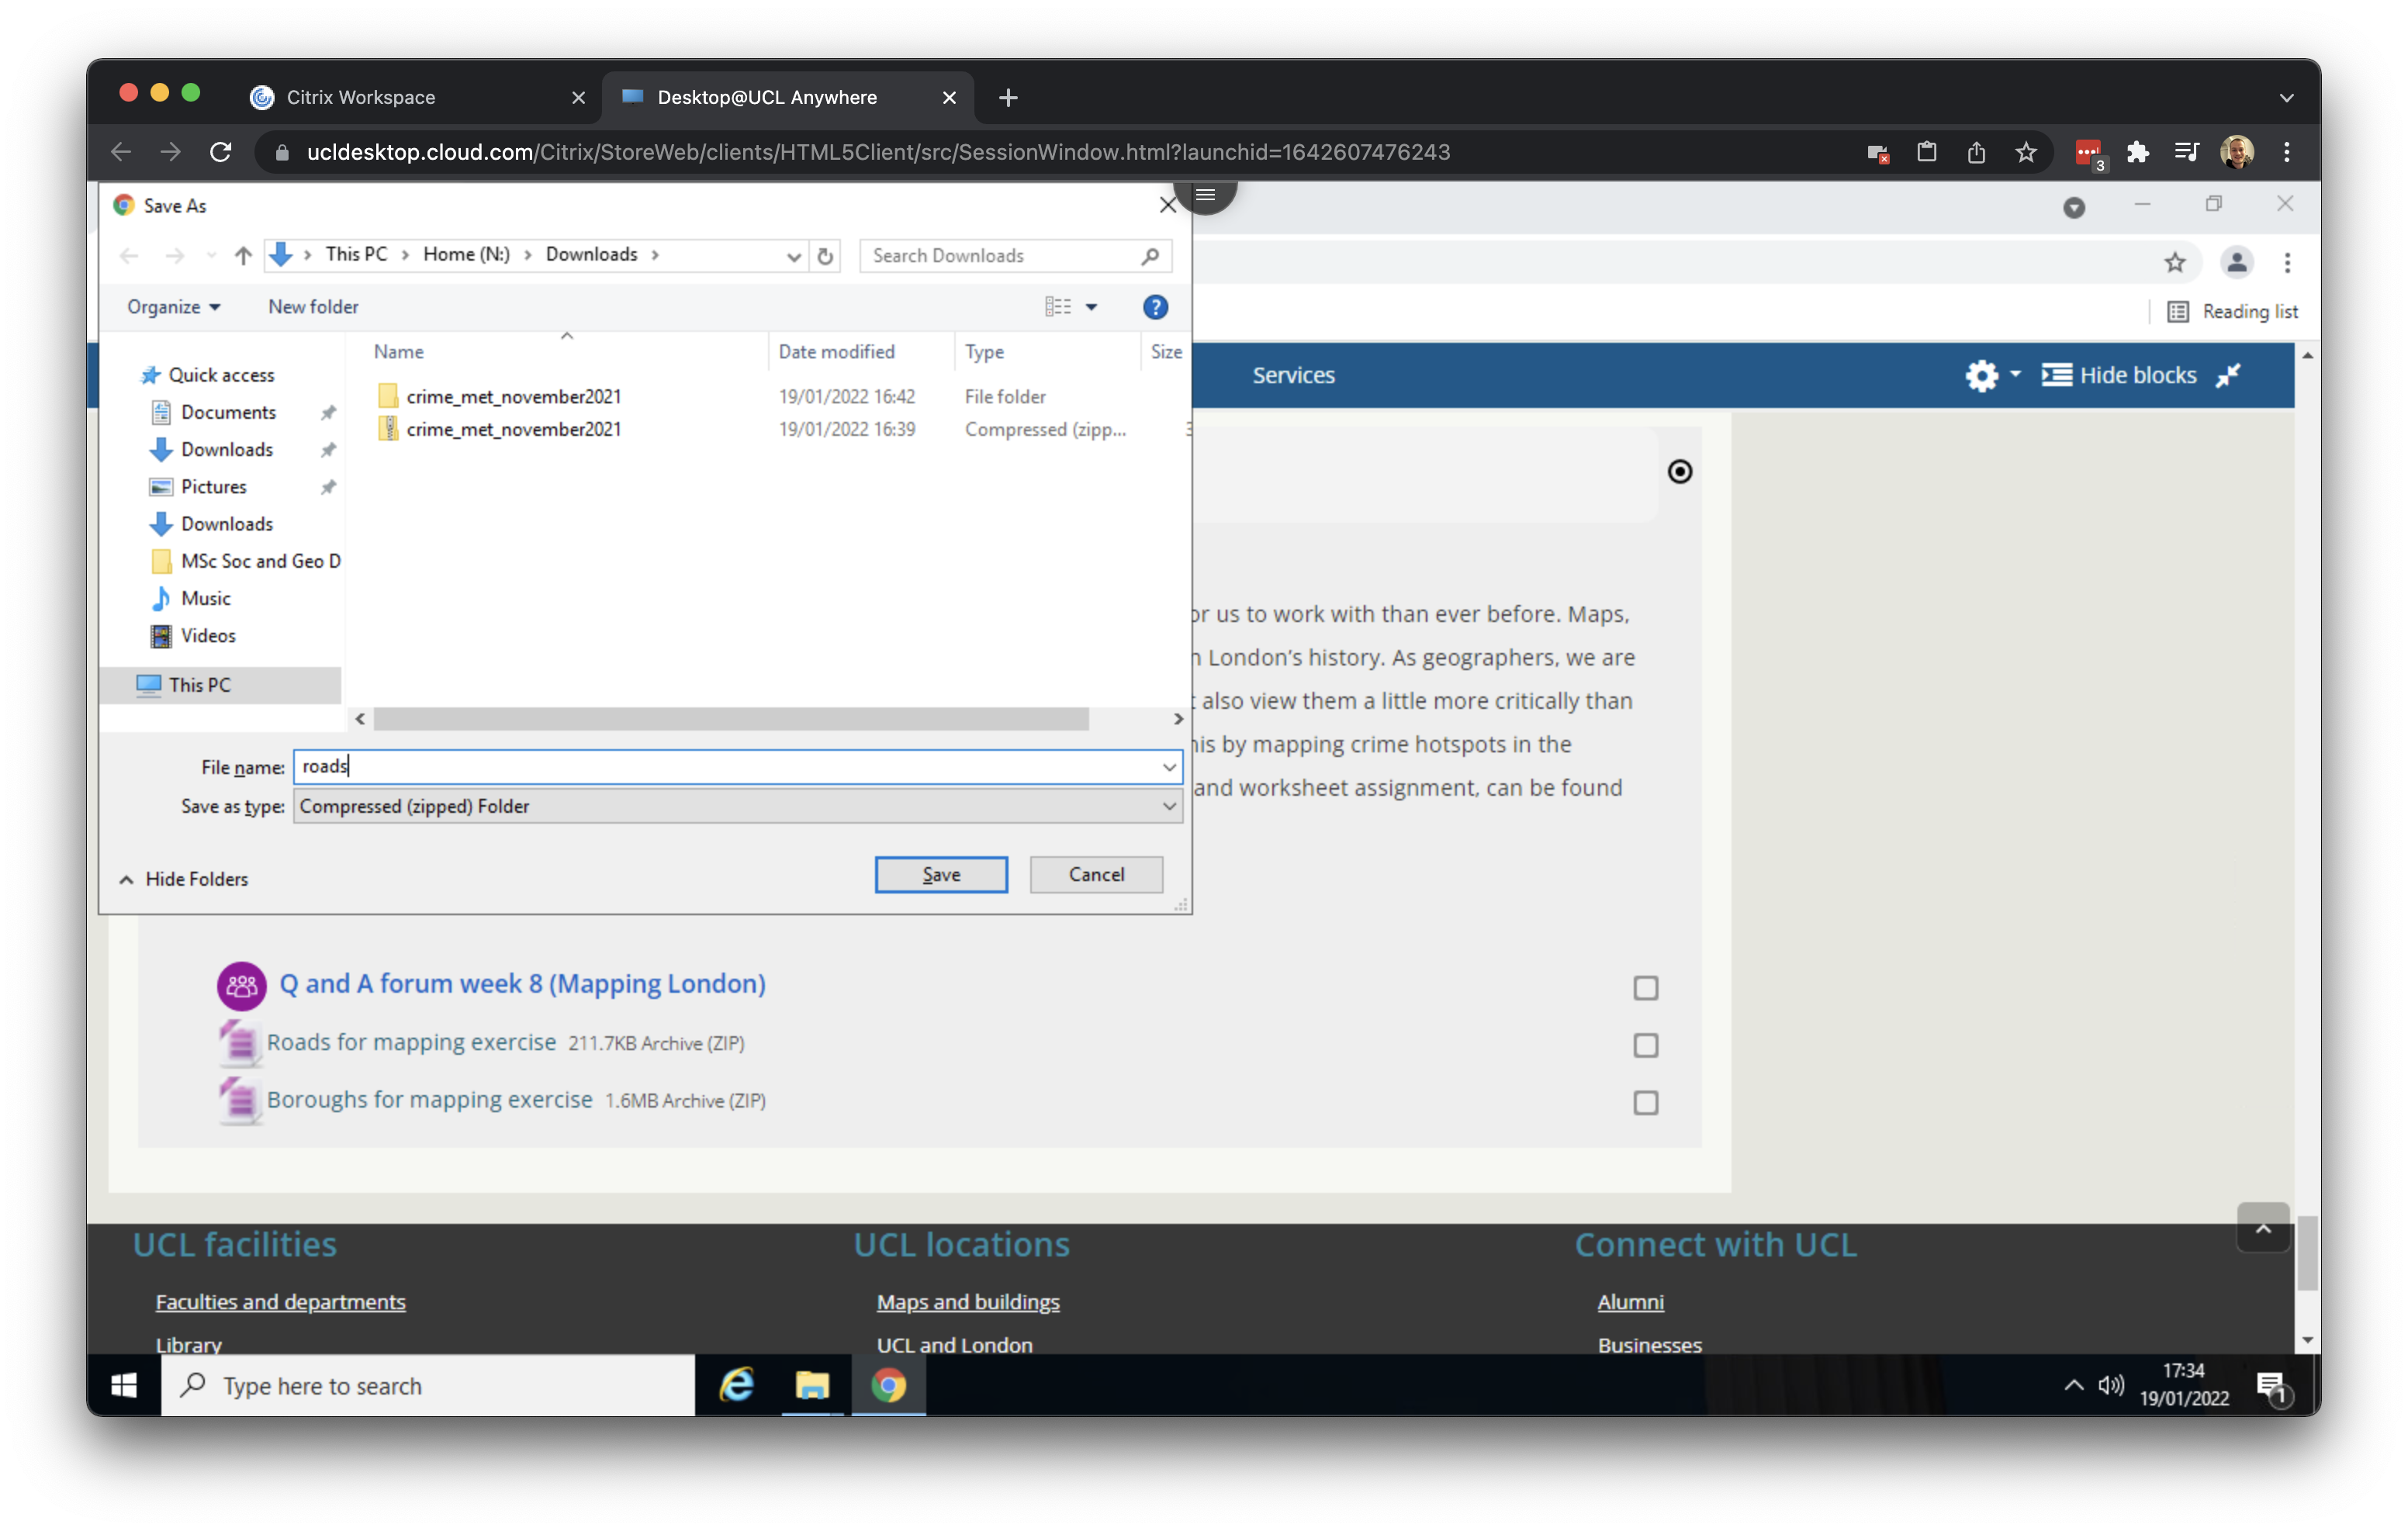
Under the Further resources heading you will see two files: Roads for mapping exercise and Boroughs for mapping exercise. Right click on on the first file and click on Save link as …. Give the file the name roads and save to your download folder.
Right click on on the second file and click on Save link as …. Give the file the name boroughs and save to your download folder.
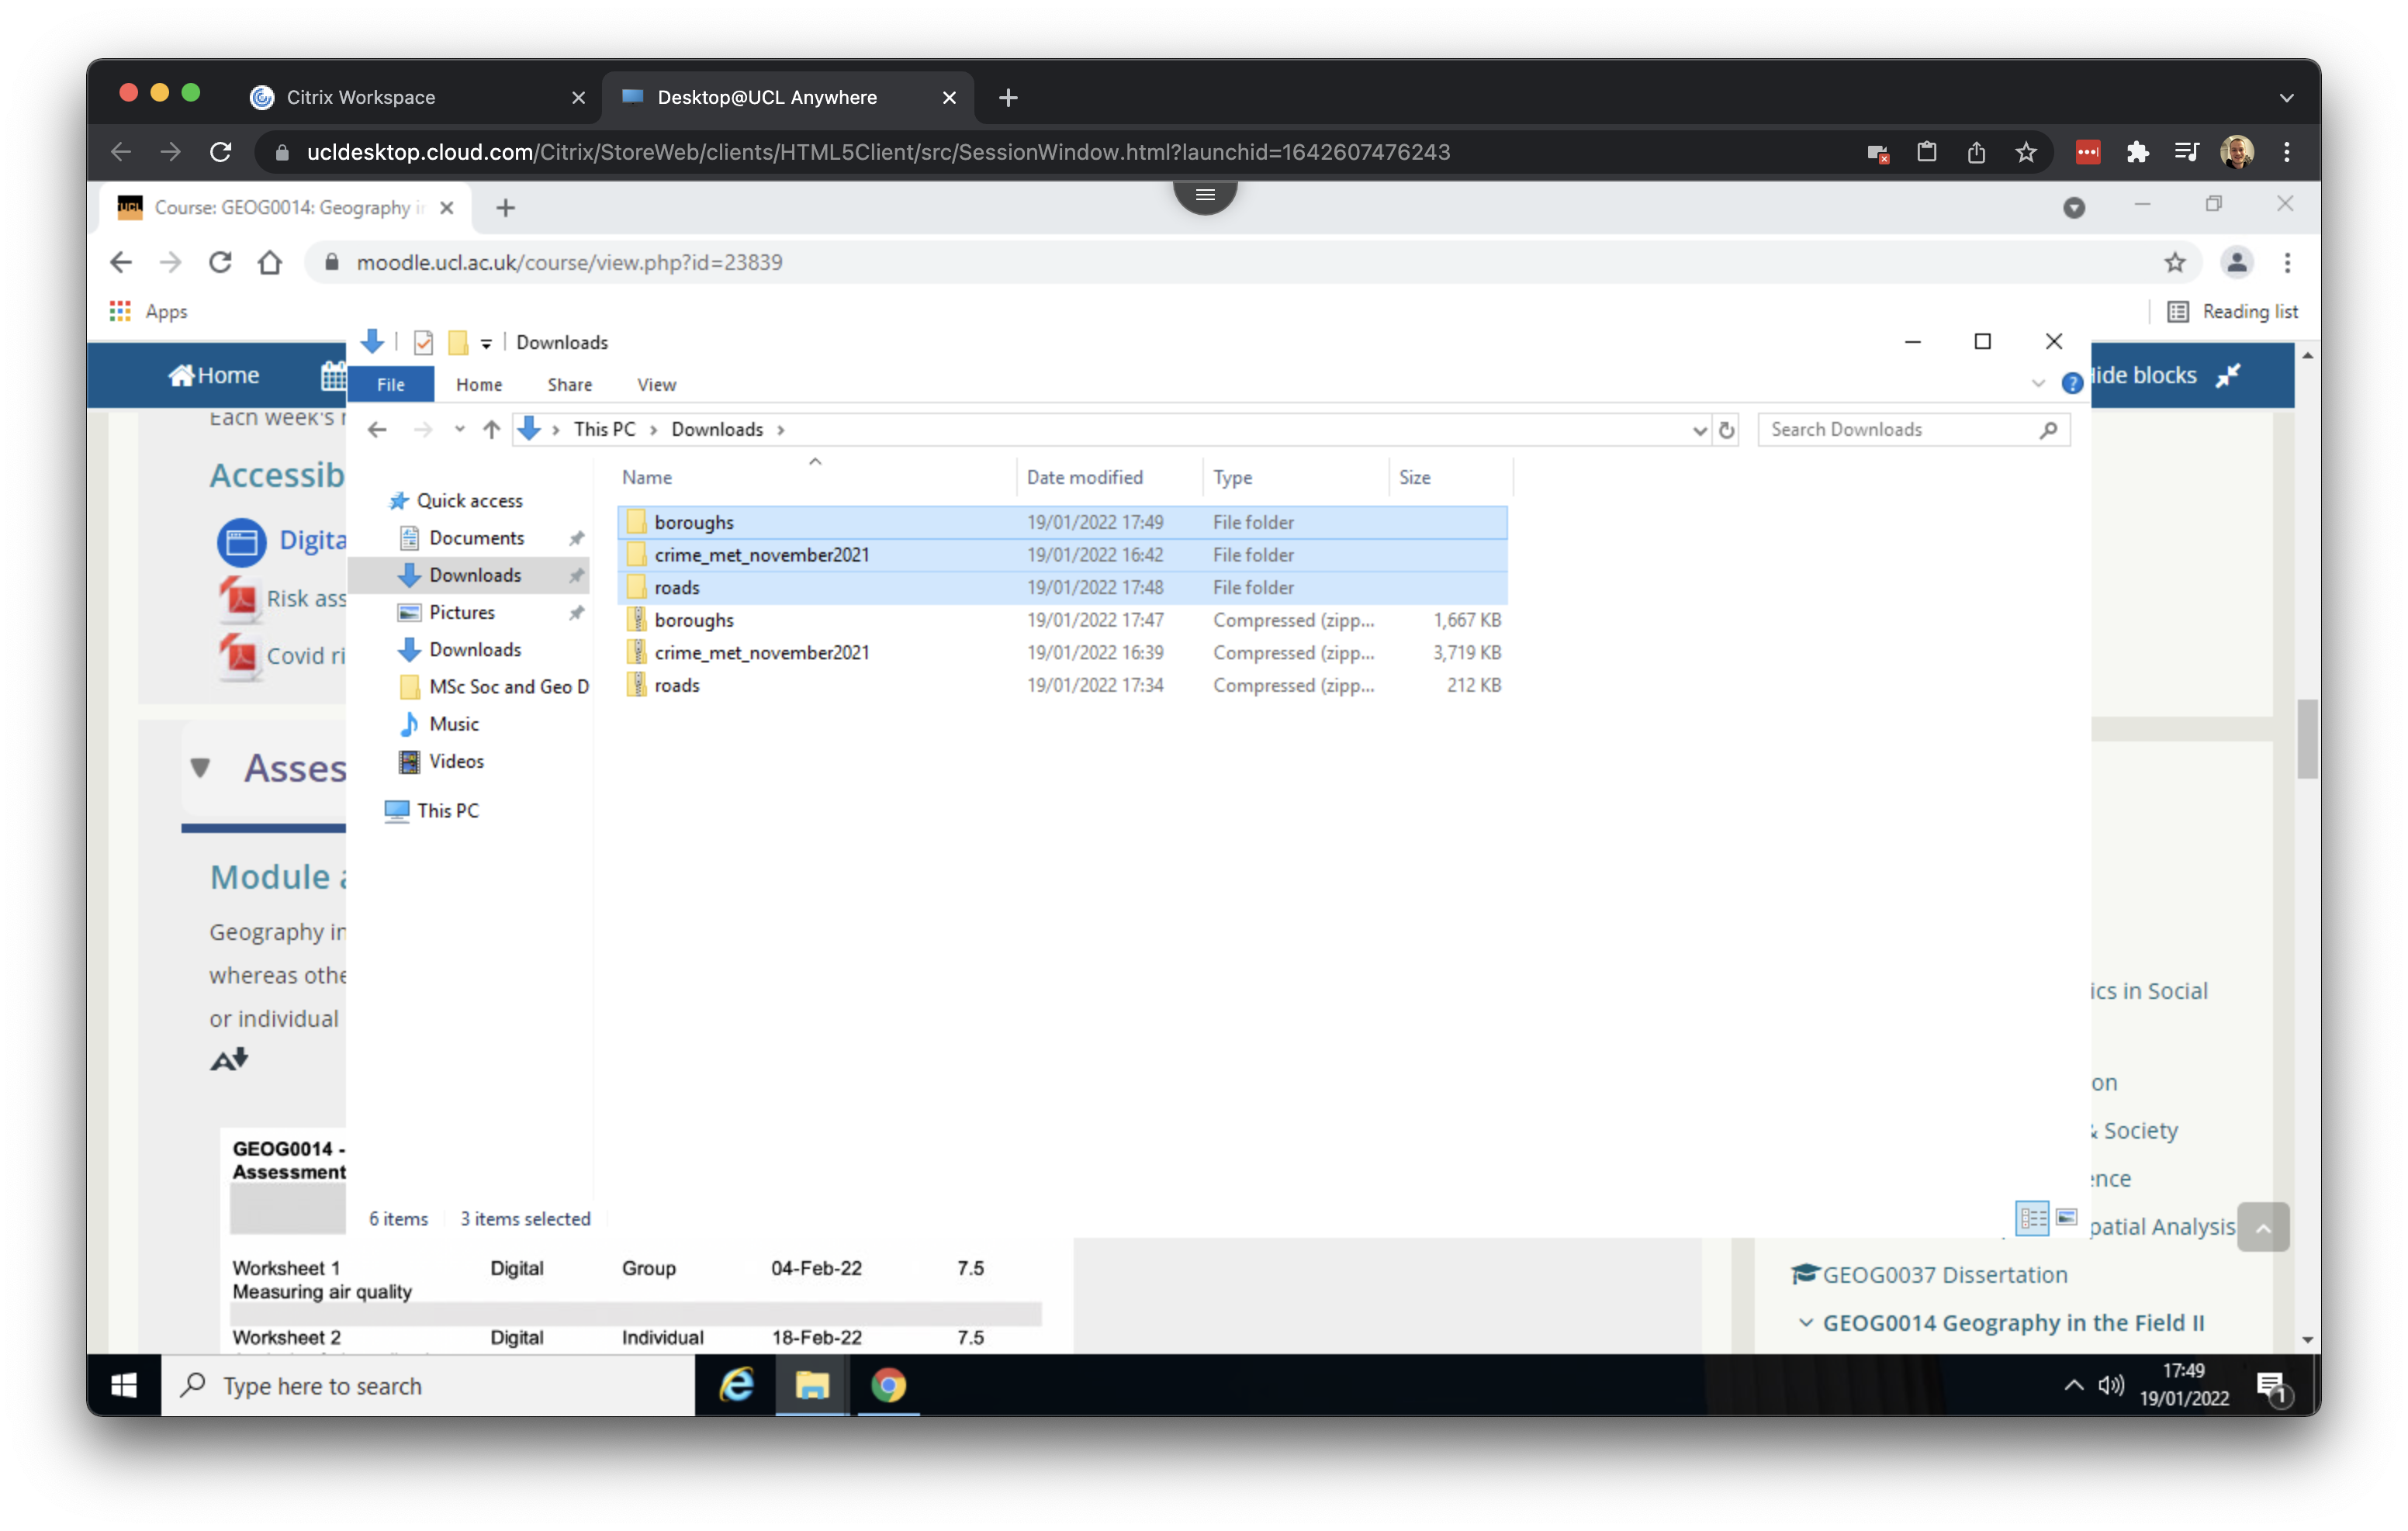
After downloading both files, go to your Downloads folder and make sure both are extracted. Your Downloads folder should look something like this:
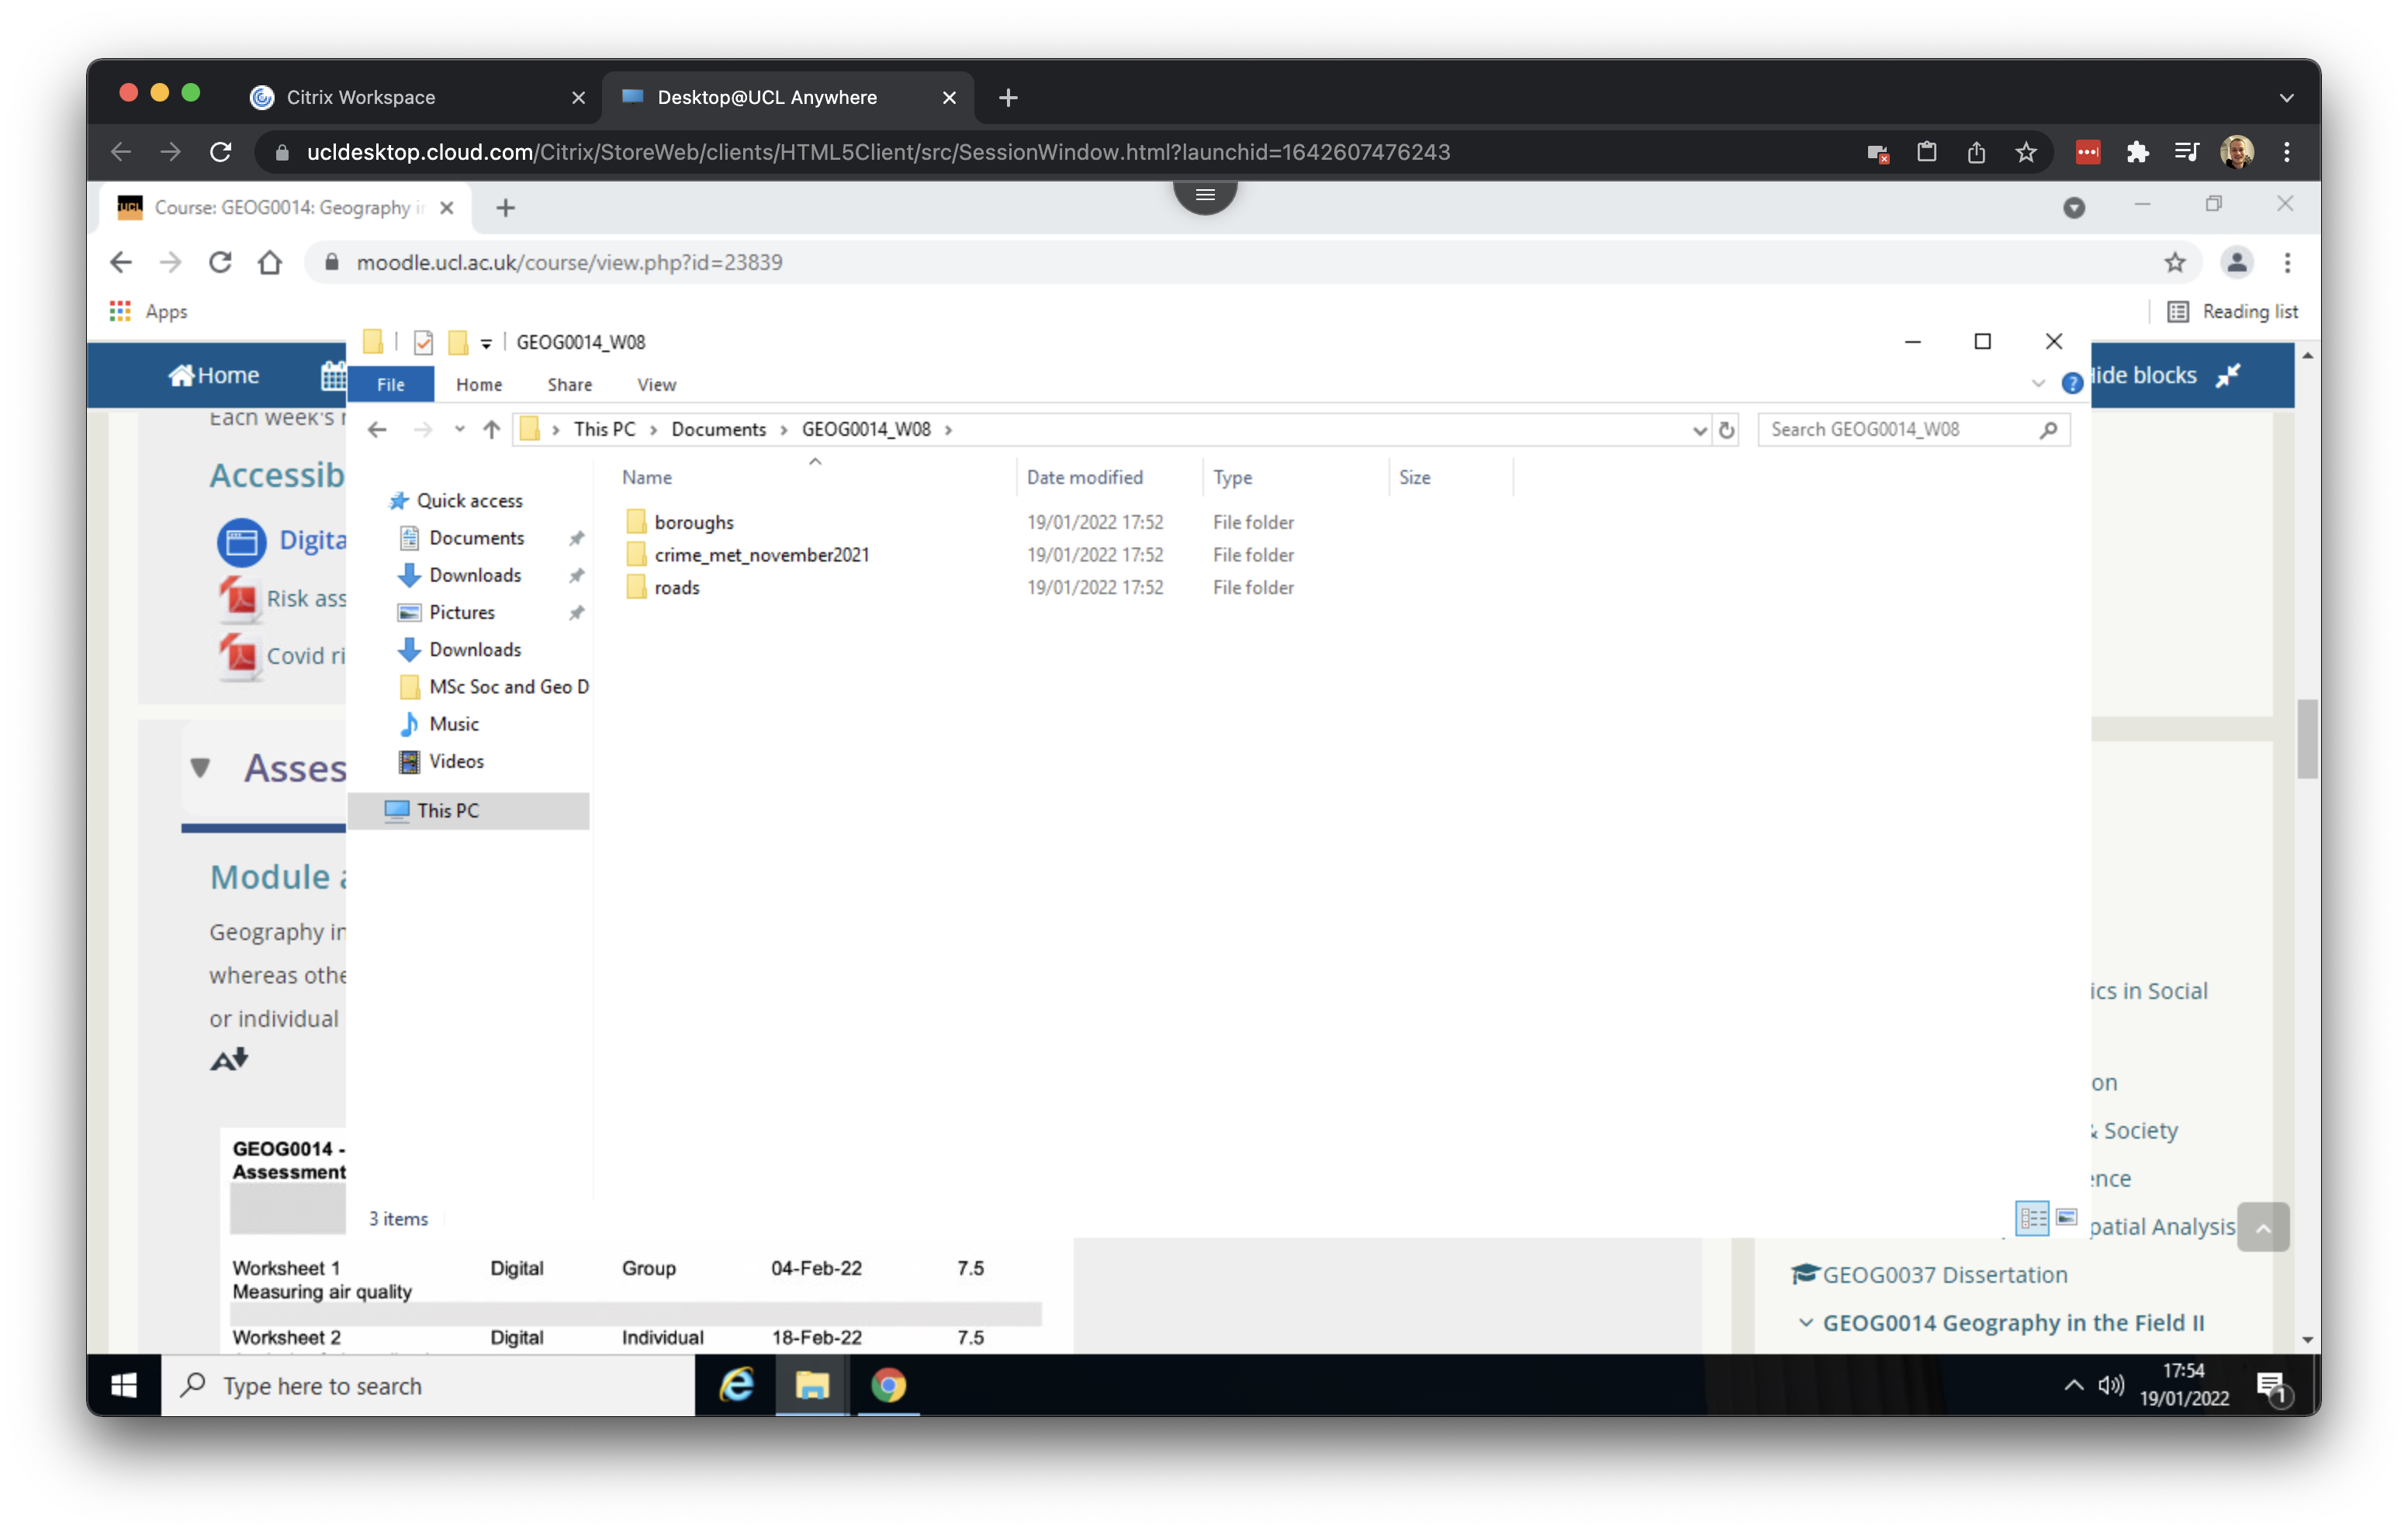
The final step is to organise our downloaded data. In your Documents folder, create a new folder called GEOG0014_W08. This will serve as our working directory. Now move the three unzipped folders containing the crime data, borough data and road data from your Downloads folder into the newly created GEOG0014_W08 folder. Your working directory should look something like this:
The roads and boroughs files we downloaded are in a format called a shapefile, which is used by GIS software to store spatial data. Despite the name, a shapefile is not just a single file but a collection of related files. Each file within the shapefile set serves a specific function, and the GIS software requires all of them to correctly interpret and display the spatial data.
While shapefiles are still widely used and many online spatial files are available in this format, they are somewhat outdated. A more modern alternative is the GeoPackage format, and we recommend using a GeoPackage whenever possible.
We now have now downloaded and oranised all the datasets we need and are ready to move on to QGIS to create some maps.